Getting Started
From sign-in to your first alert in about five minutes. You'll create an integration API key, fire a test alert with curl, and watch it land in the console.
- Access is invite-only during the pilot — request access and you'll get a welcome email with a web accept link and a QR code for mobile setup. You'll need an account with the admin role (the person who set up your workspace has one).
curlon any machine that can reach your OpsPing API.- Your API base URL —
https://api.ops-ping.comfor cloud, or your private deployment's address.
-
Sign in to the admin console
Open your OpsPing URL and sign in with your team account email and password. If your organization has SSO configured, the SSO option appears below the form.
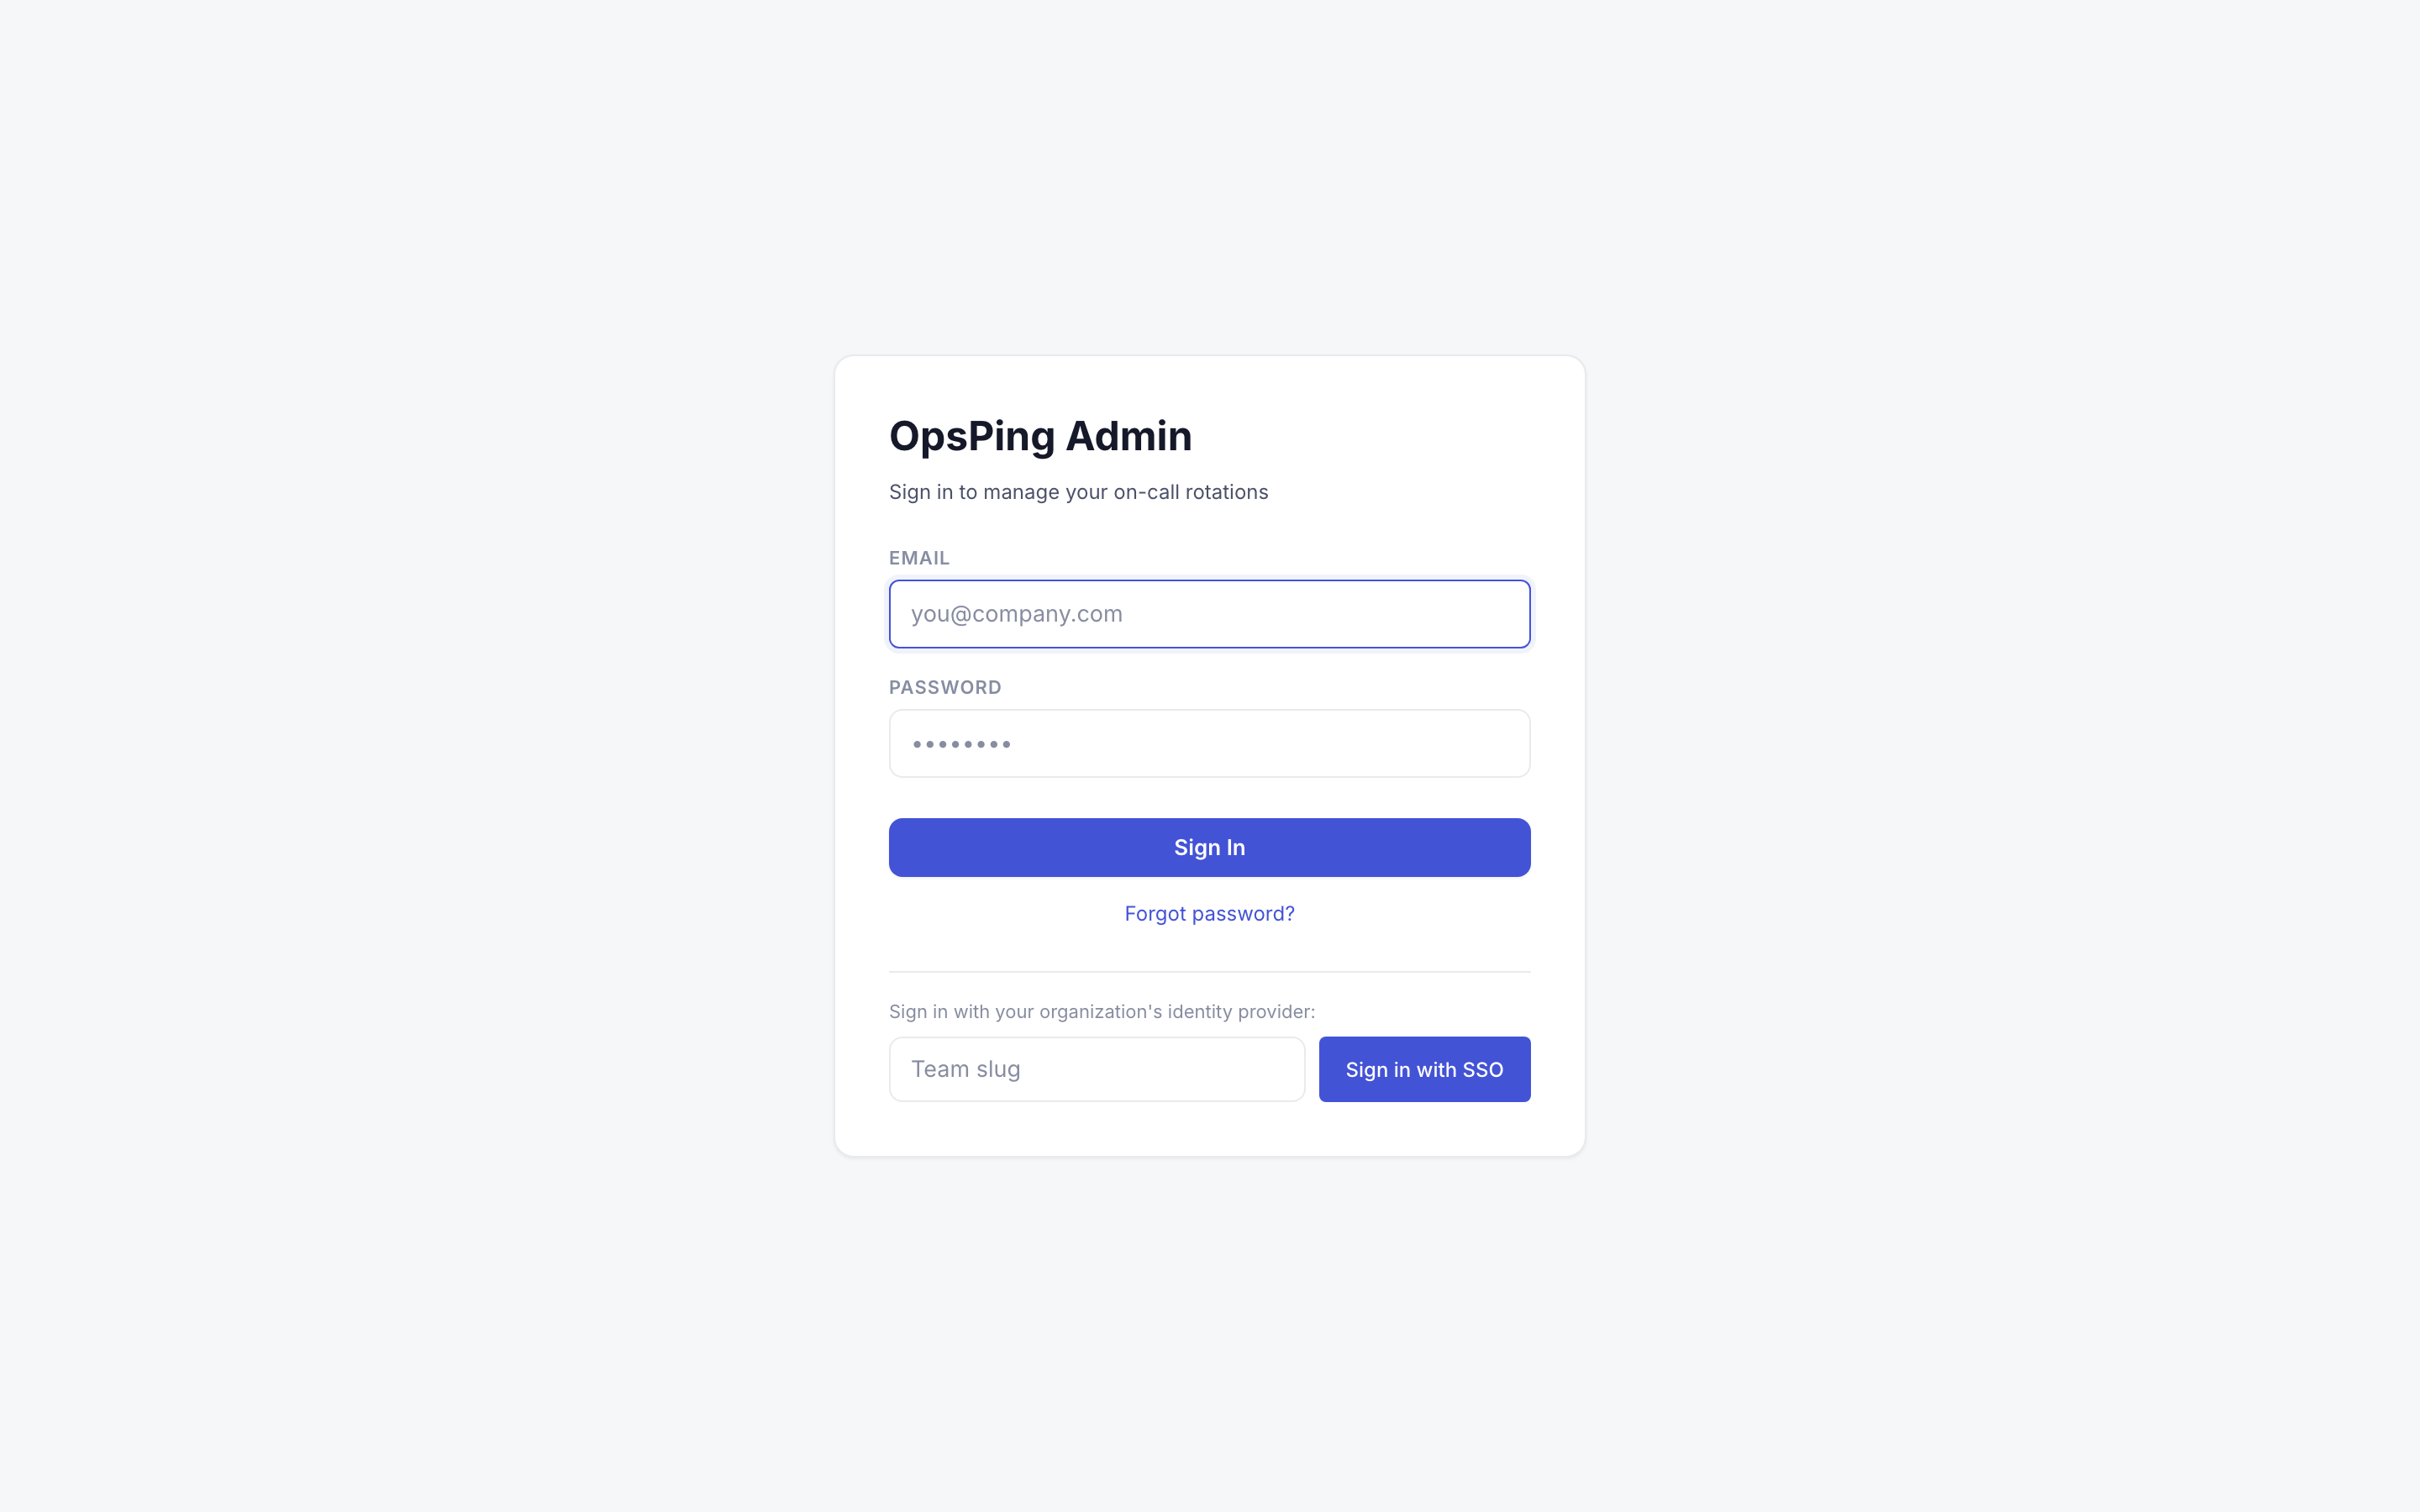
The OpsPing Admin sign-in page. Use your team account email and password; SSO is available below the form when configured. -
Get your bearings on the dashboard
After login you land on the dashboard: open and acknowledged alerts, open incidents, degraded services, recent alerts, and who is on call right now. On a fresh workspace most cards read zero — that's expected.
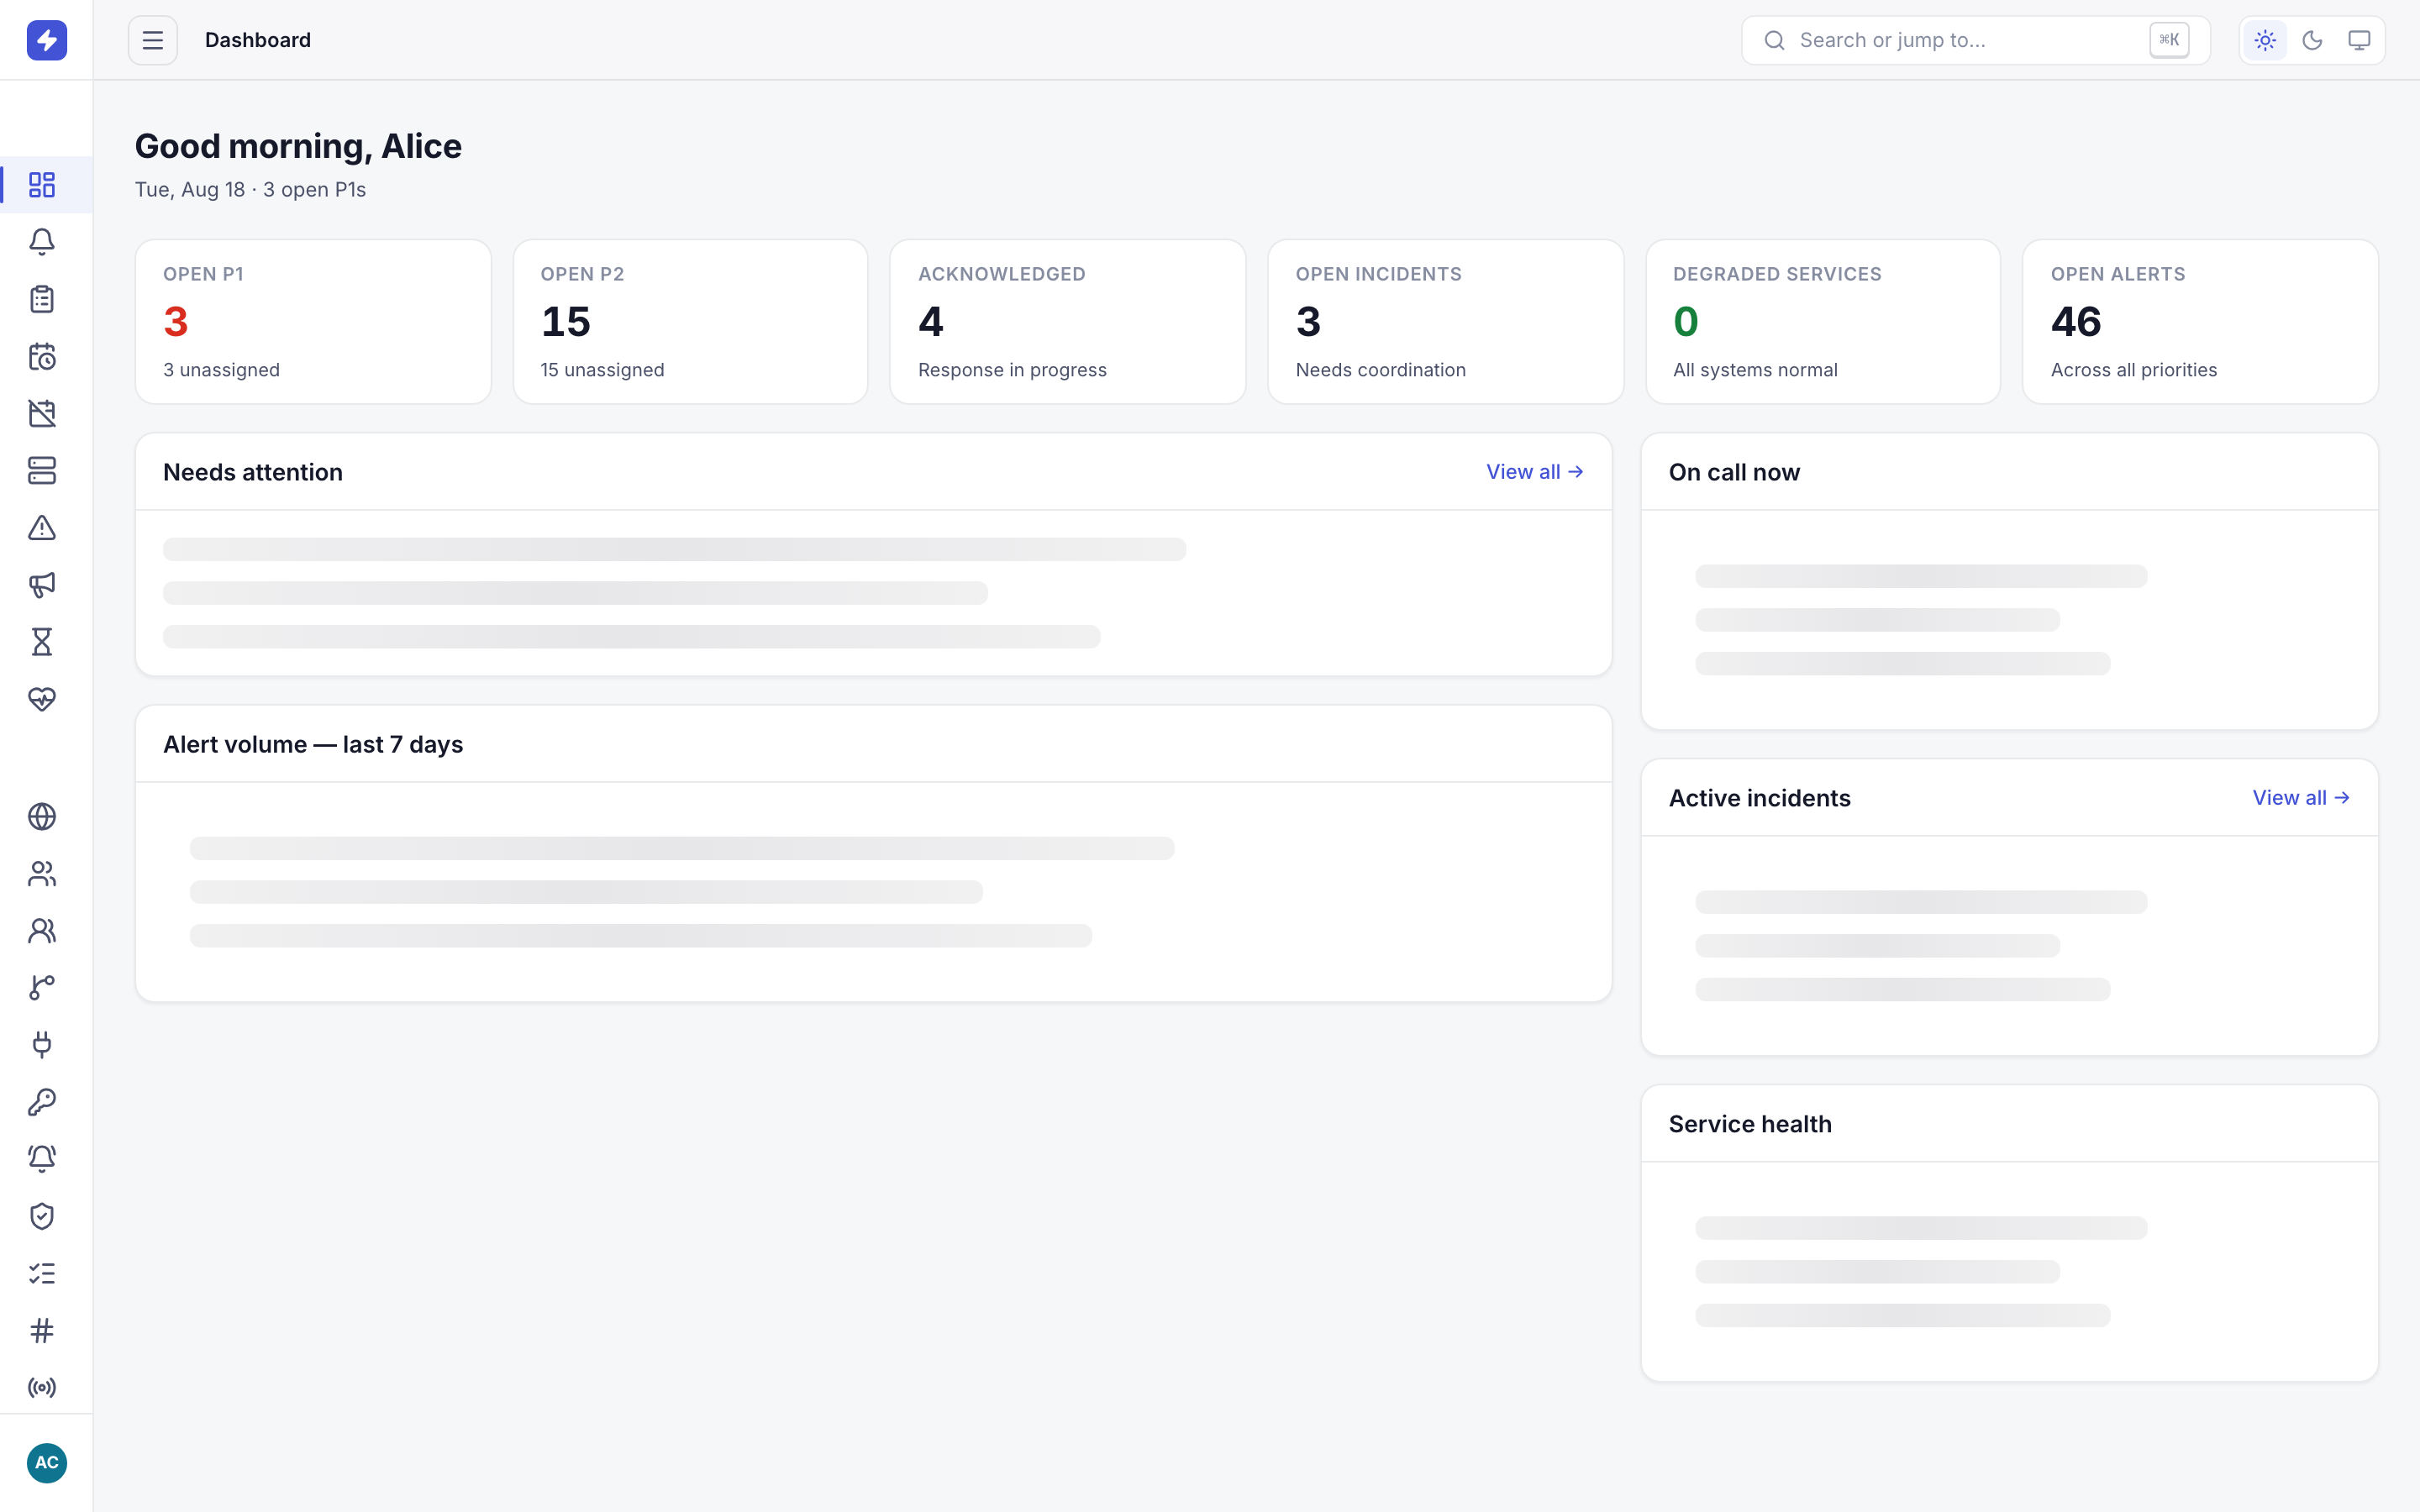
The dashboard gives an at-a-glance view: open and acknowledged alerts, open incidents, degraded services, recent alerts, and who is on call right now. TipThe console ships with a dark theme. Switch themes from the Theme control at the bottom of the sidebar — your preference is remembered per browser.
-
Run the onboarding wizard on first sign-in
The first time you sign in, OpsPing offers a six-step onboarding wizard that walks you through the people-side of setup — inviting your team, creating your first schedule, and sending a test alert. It's the fastest path to a working workspace. Prefer to drive manually? Skip it and use the steps below.
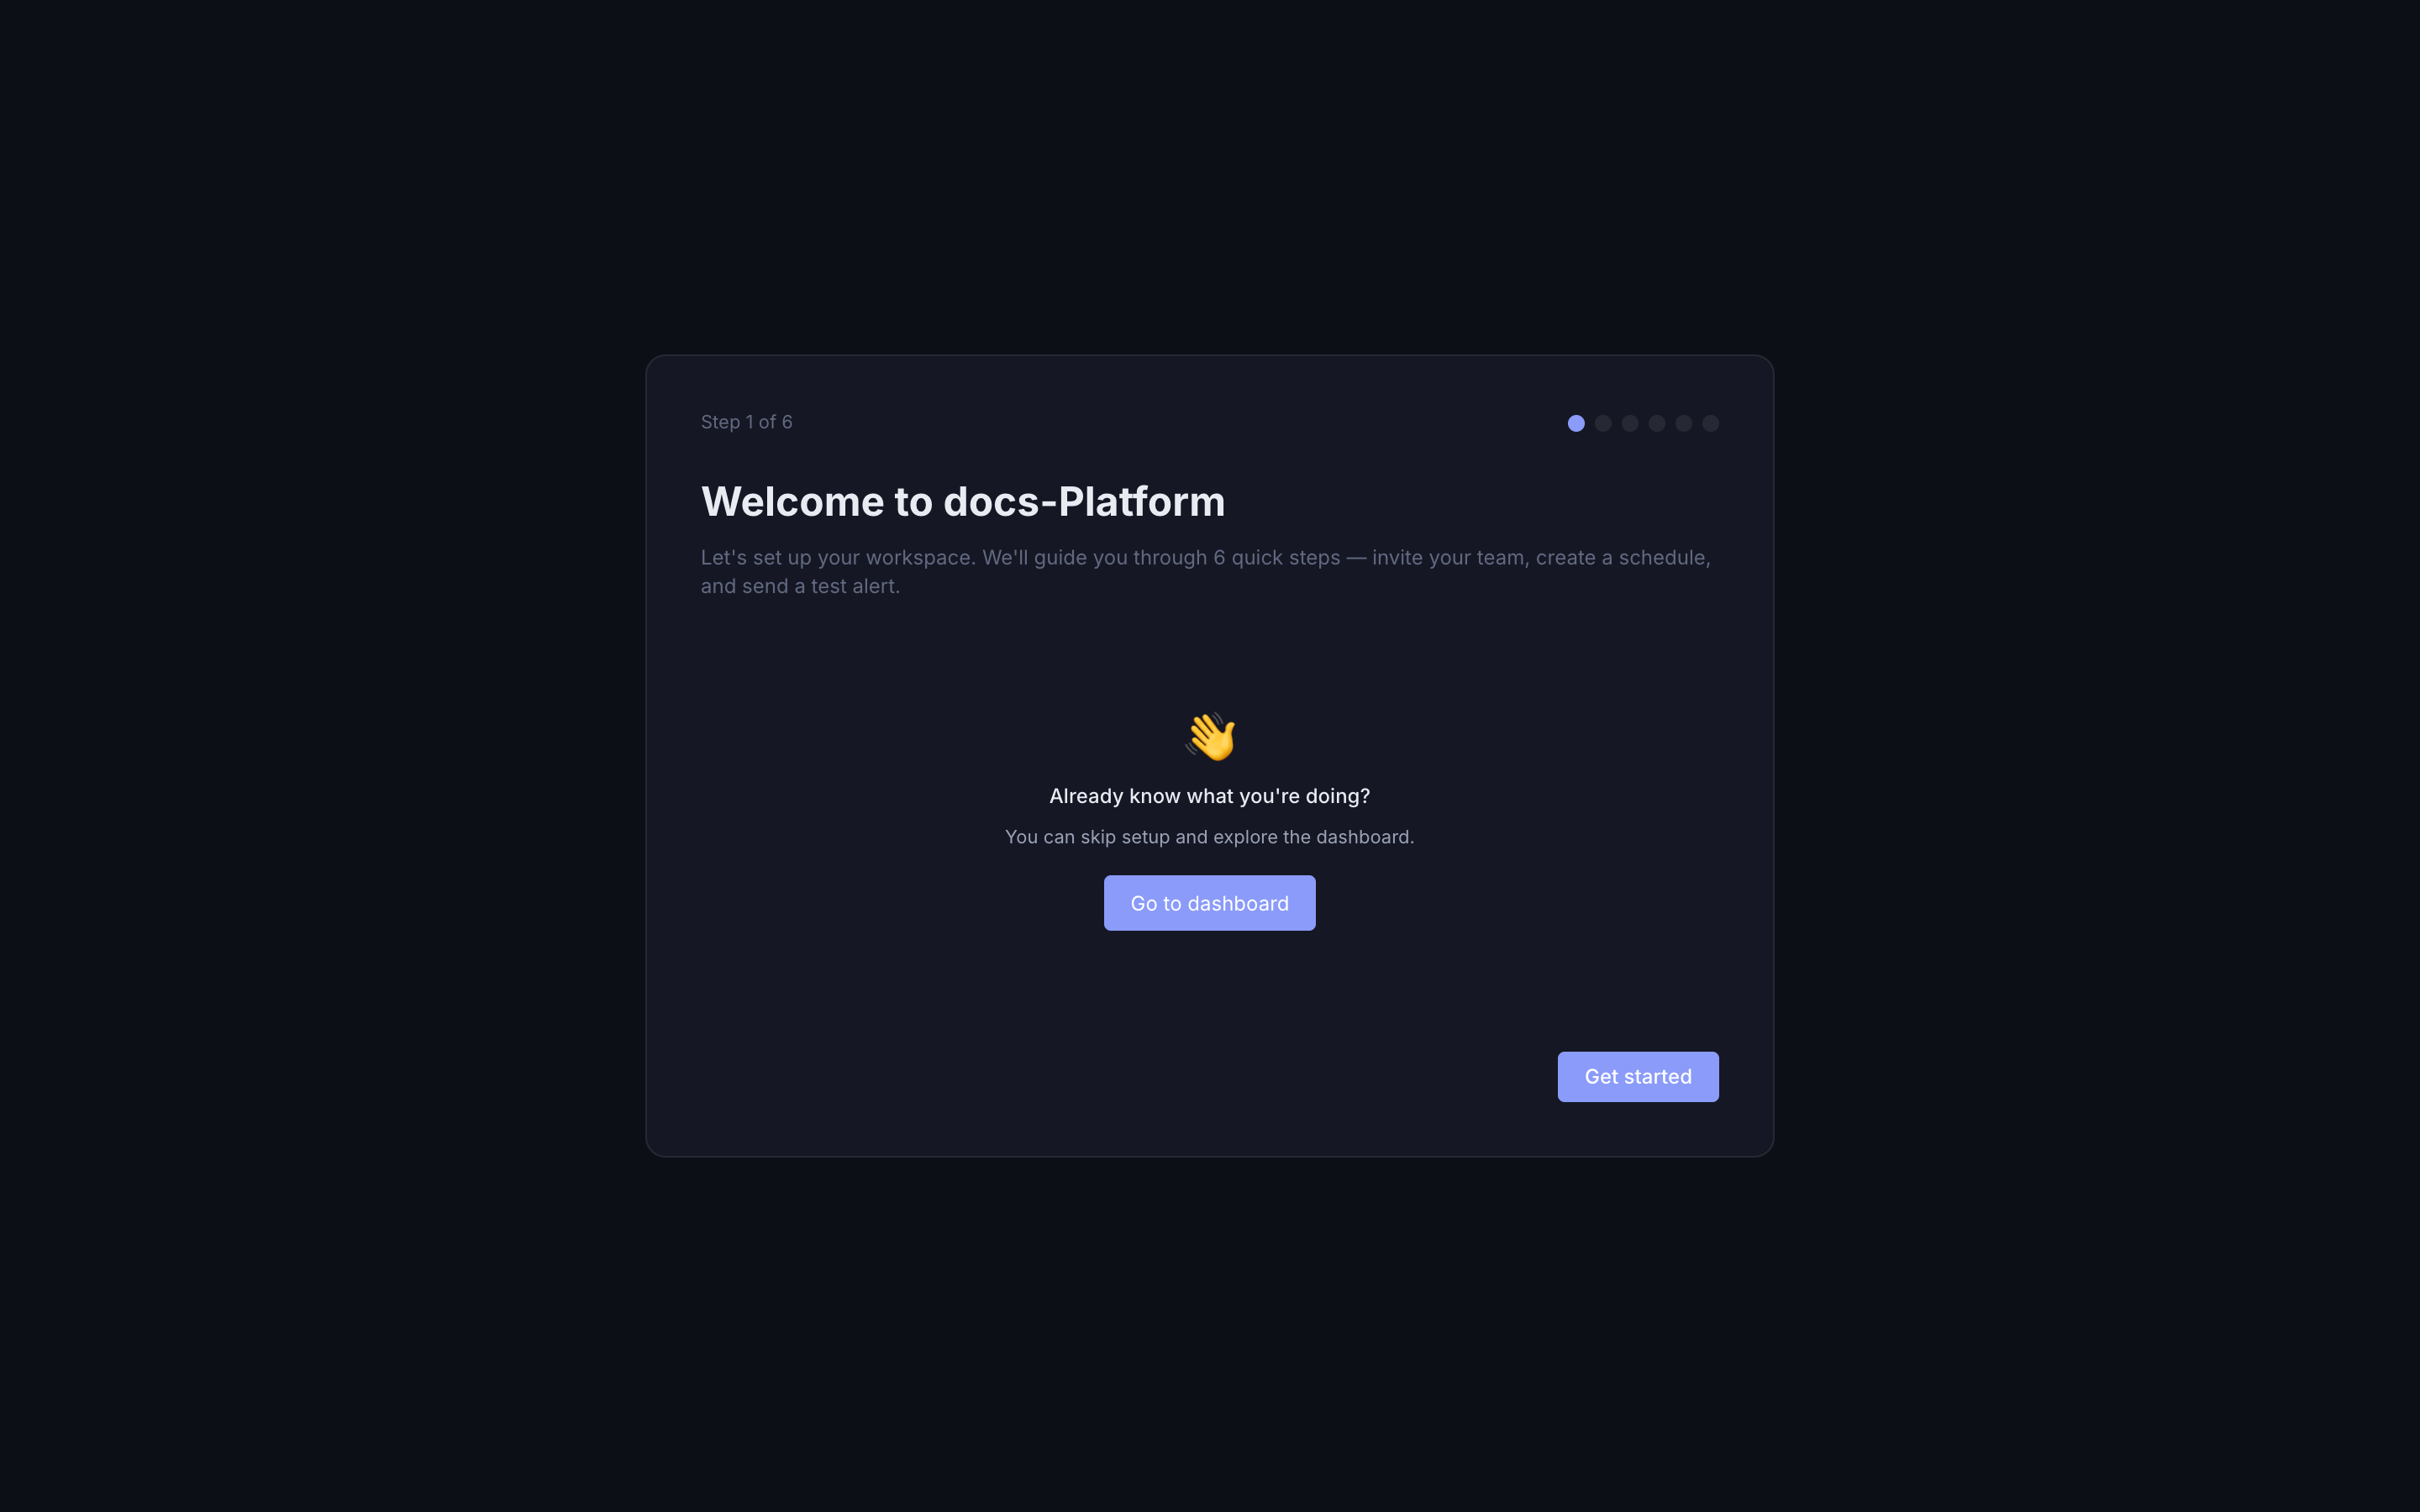
Step 1 of 6: the wizard offers to guide you through setup, or you can go straight to the dashboard and configure things manually. NoteThe wizard covers the setup the alert steps below assume is done — teammates to page and a schedule that decides who's on call. You can re-enter it any time from the console.
-
Create an integration
Go to Integrations in the sidebar and click New Integration. Give it a name that identifies the source (e.g.
prometheus-prod), pick a type, and set the scopes the key needs. For sending alerts, write is the scope that matters; add read/delete only if the tool also queries or closes alerts through the API.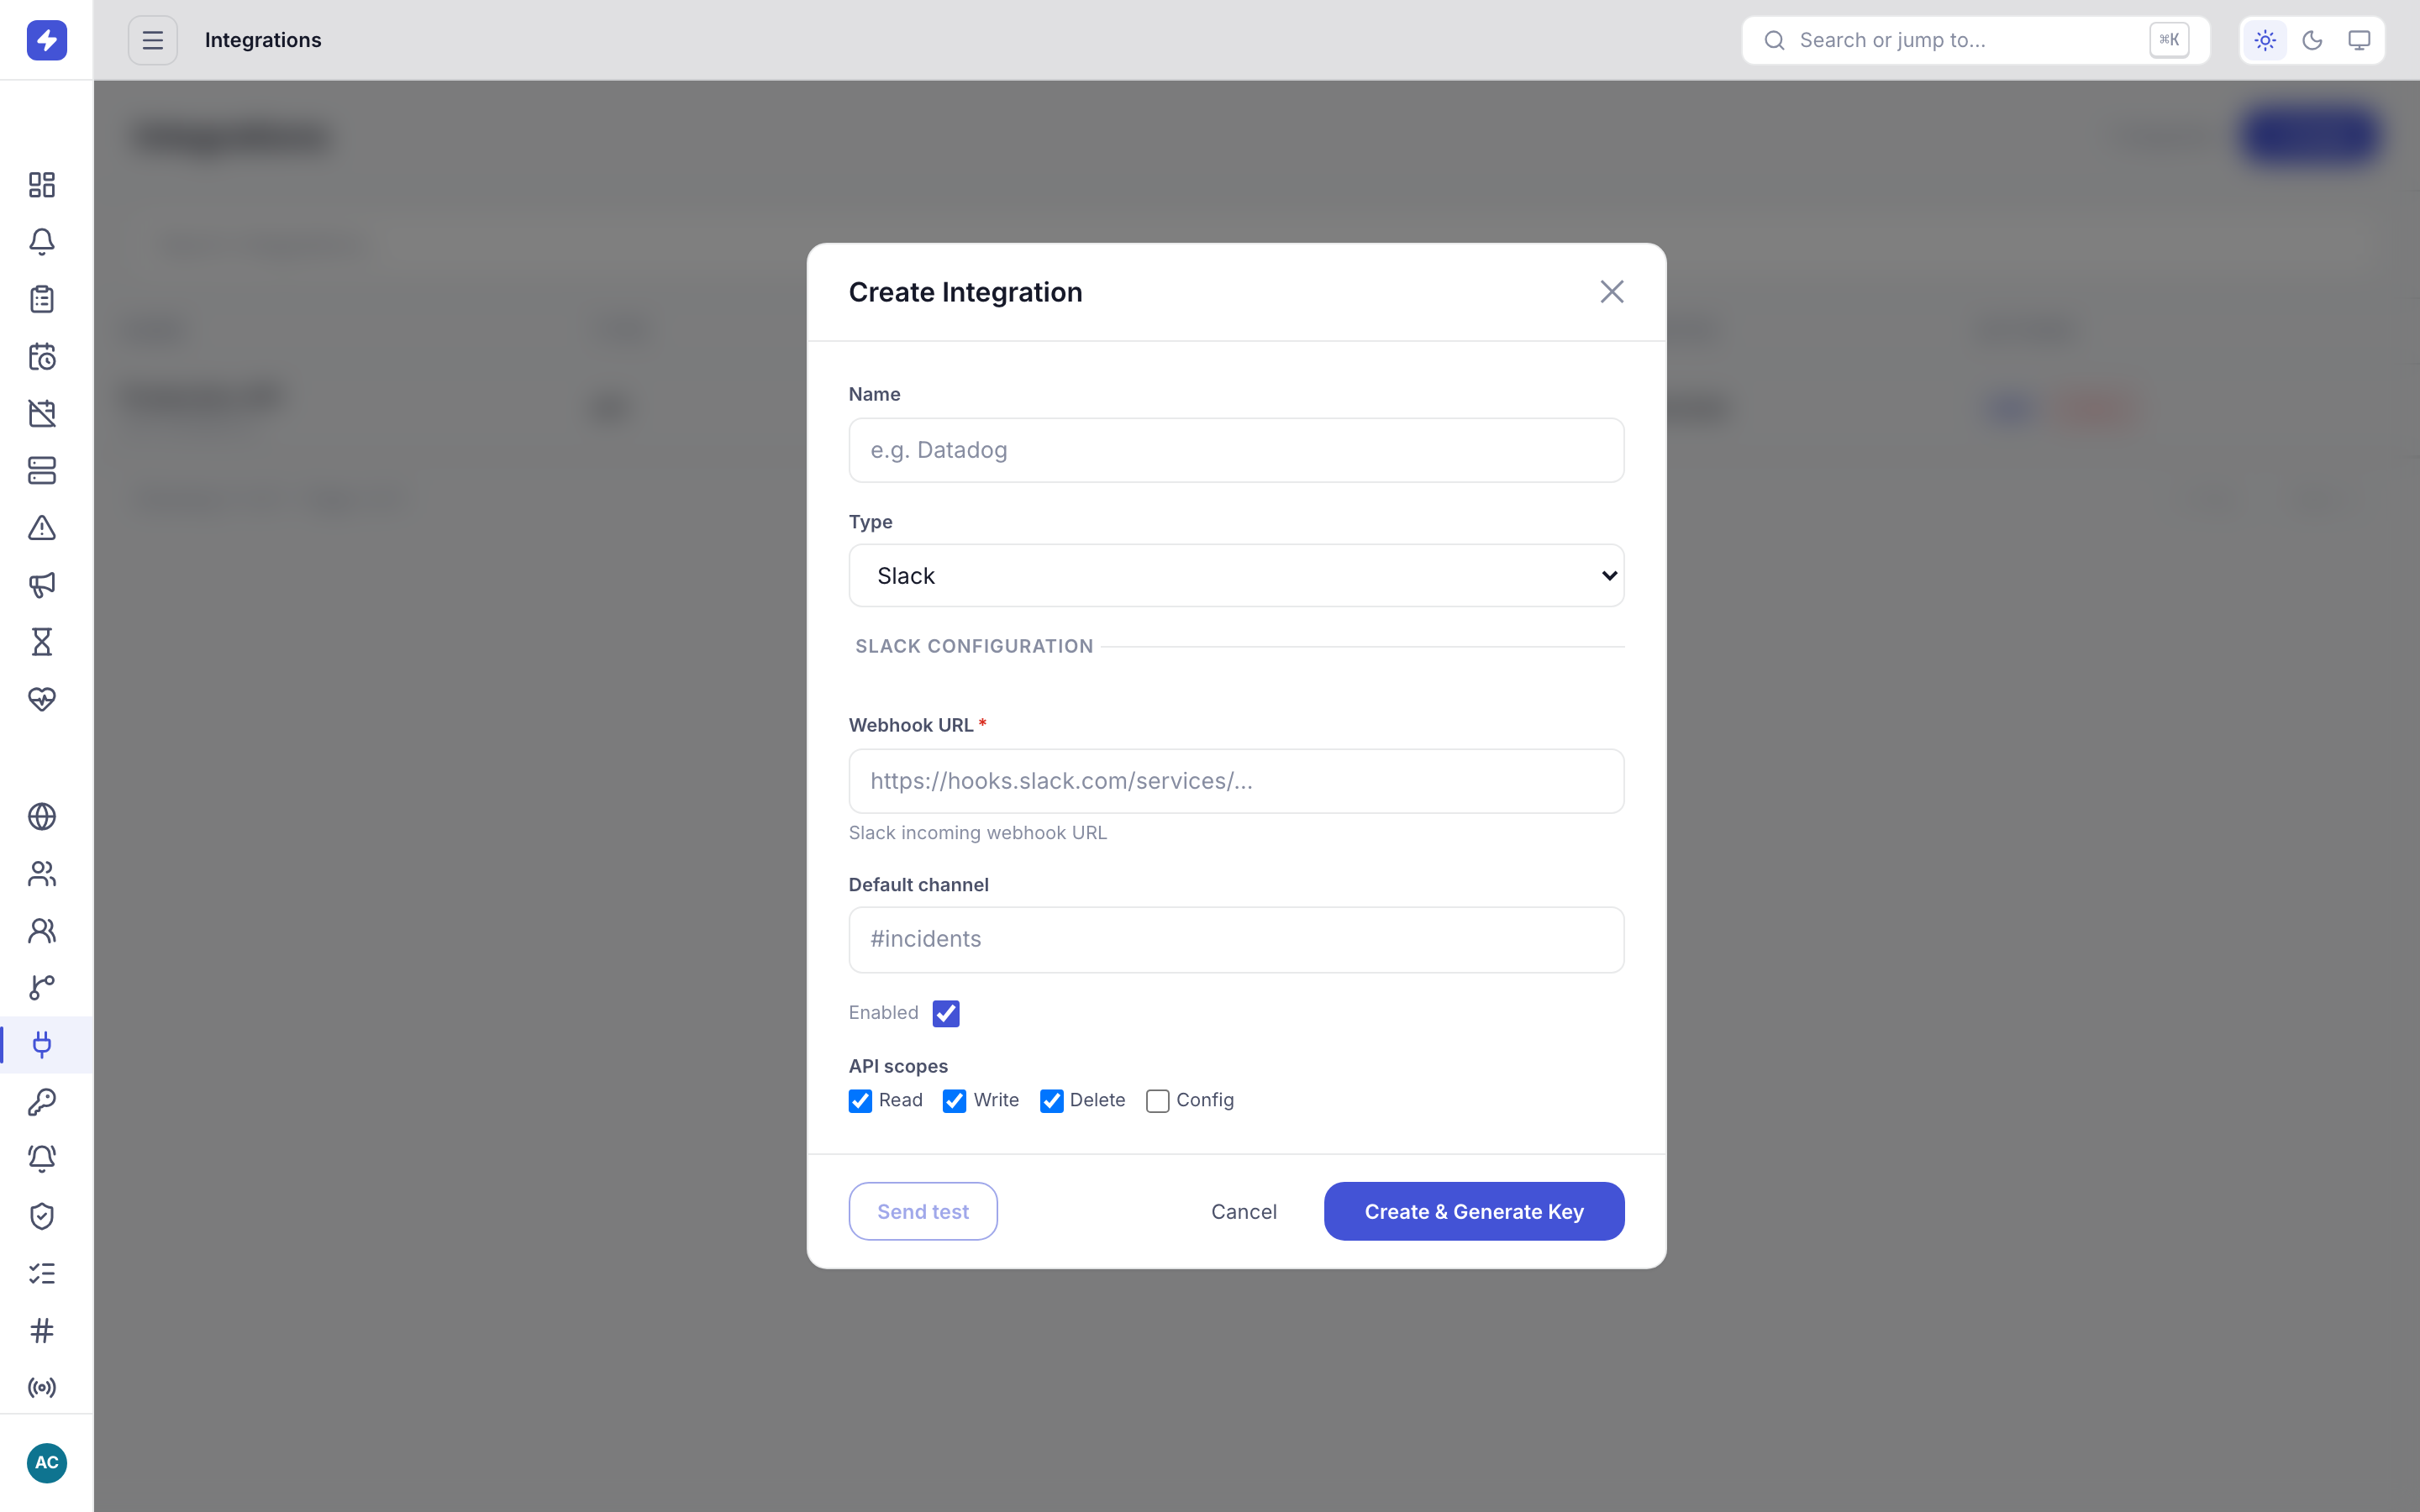
Creating an integration: pick a type, set scopes, and OpsPing generates an API key shown once after creation. -
Copy the API key — now
OpsPing shows the generated API key exactly once, immediately after creation. Copy it into your secrets manager before closing the dialog.
WarningThe key is stored hashed and cannot be recovered later. If you lose it, regenerate the key on the integration — the old key stops working the moment the new one is issued.
-
Send your first alert
Authenticate with the
OpsPingKeyscheme and post an alert:curl -X POST https://api.ops-ping.com/v2/alerts \ -H "Authorization: OpsPingKey YOUR_API_KEY" \ -H "Content-Type: application/json" \ -d '{"message": "Test alert — setup complete", "priority": "P3"}'A
202response with a body like{"result":"Request will be processed","alertId":"…"}means it's in.401means the key is wrong or missing the write scope;429means you've hit the rate limit — back off and retry.NoteMigrating from Opsgenie? The
GenieKeyscheme is accepted as an alias forOpsPingKey, so existing tooling keeps working while you migrate. See the Migration guide. -
See it in the alerts list
Open Alerts in the sidebar. Your test alert sits at the top in the Open state. Click it to acknowledge, add a note, or close it — the full lifecycle is covered in Alert triage.
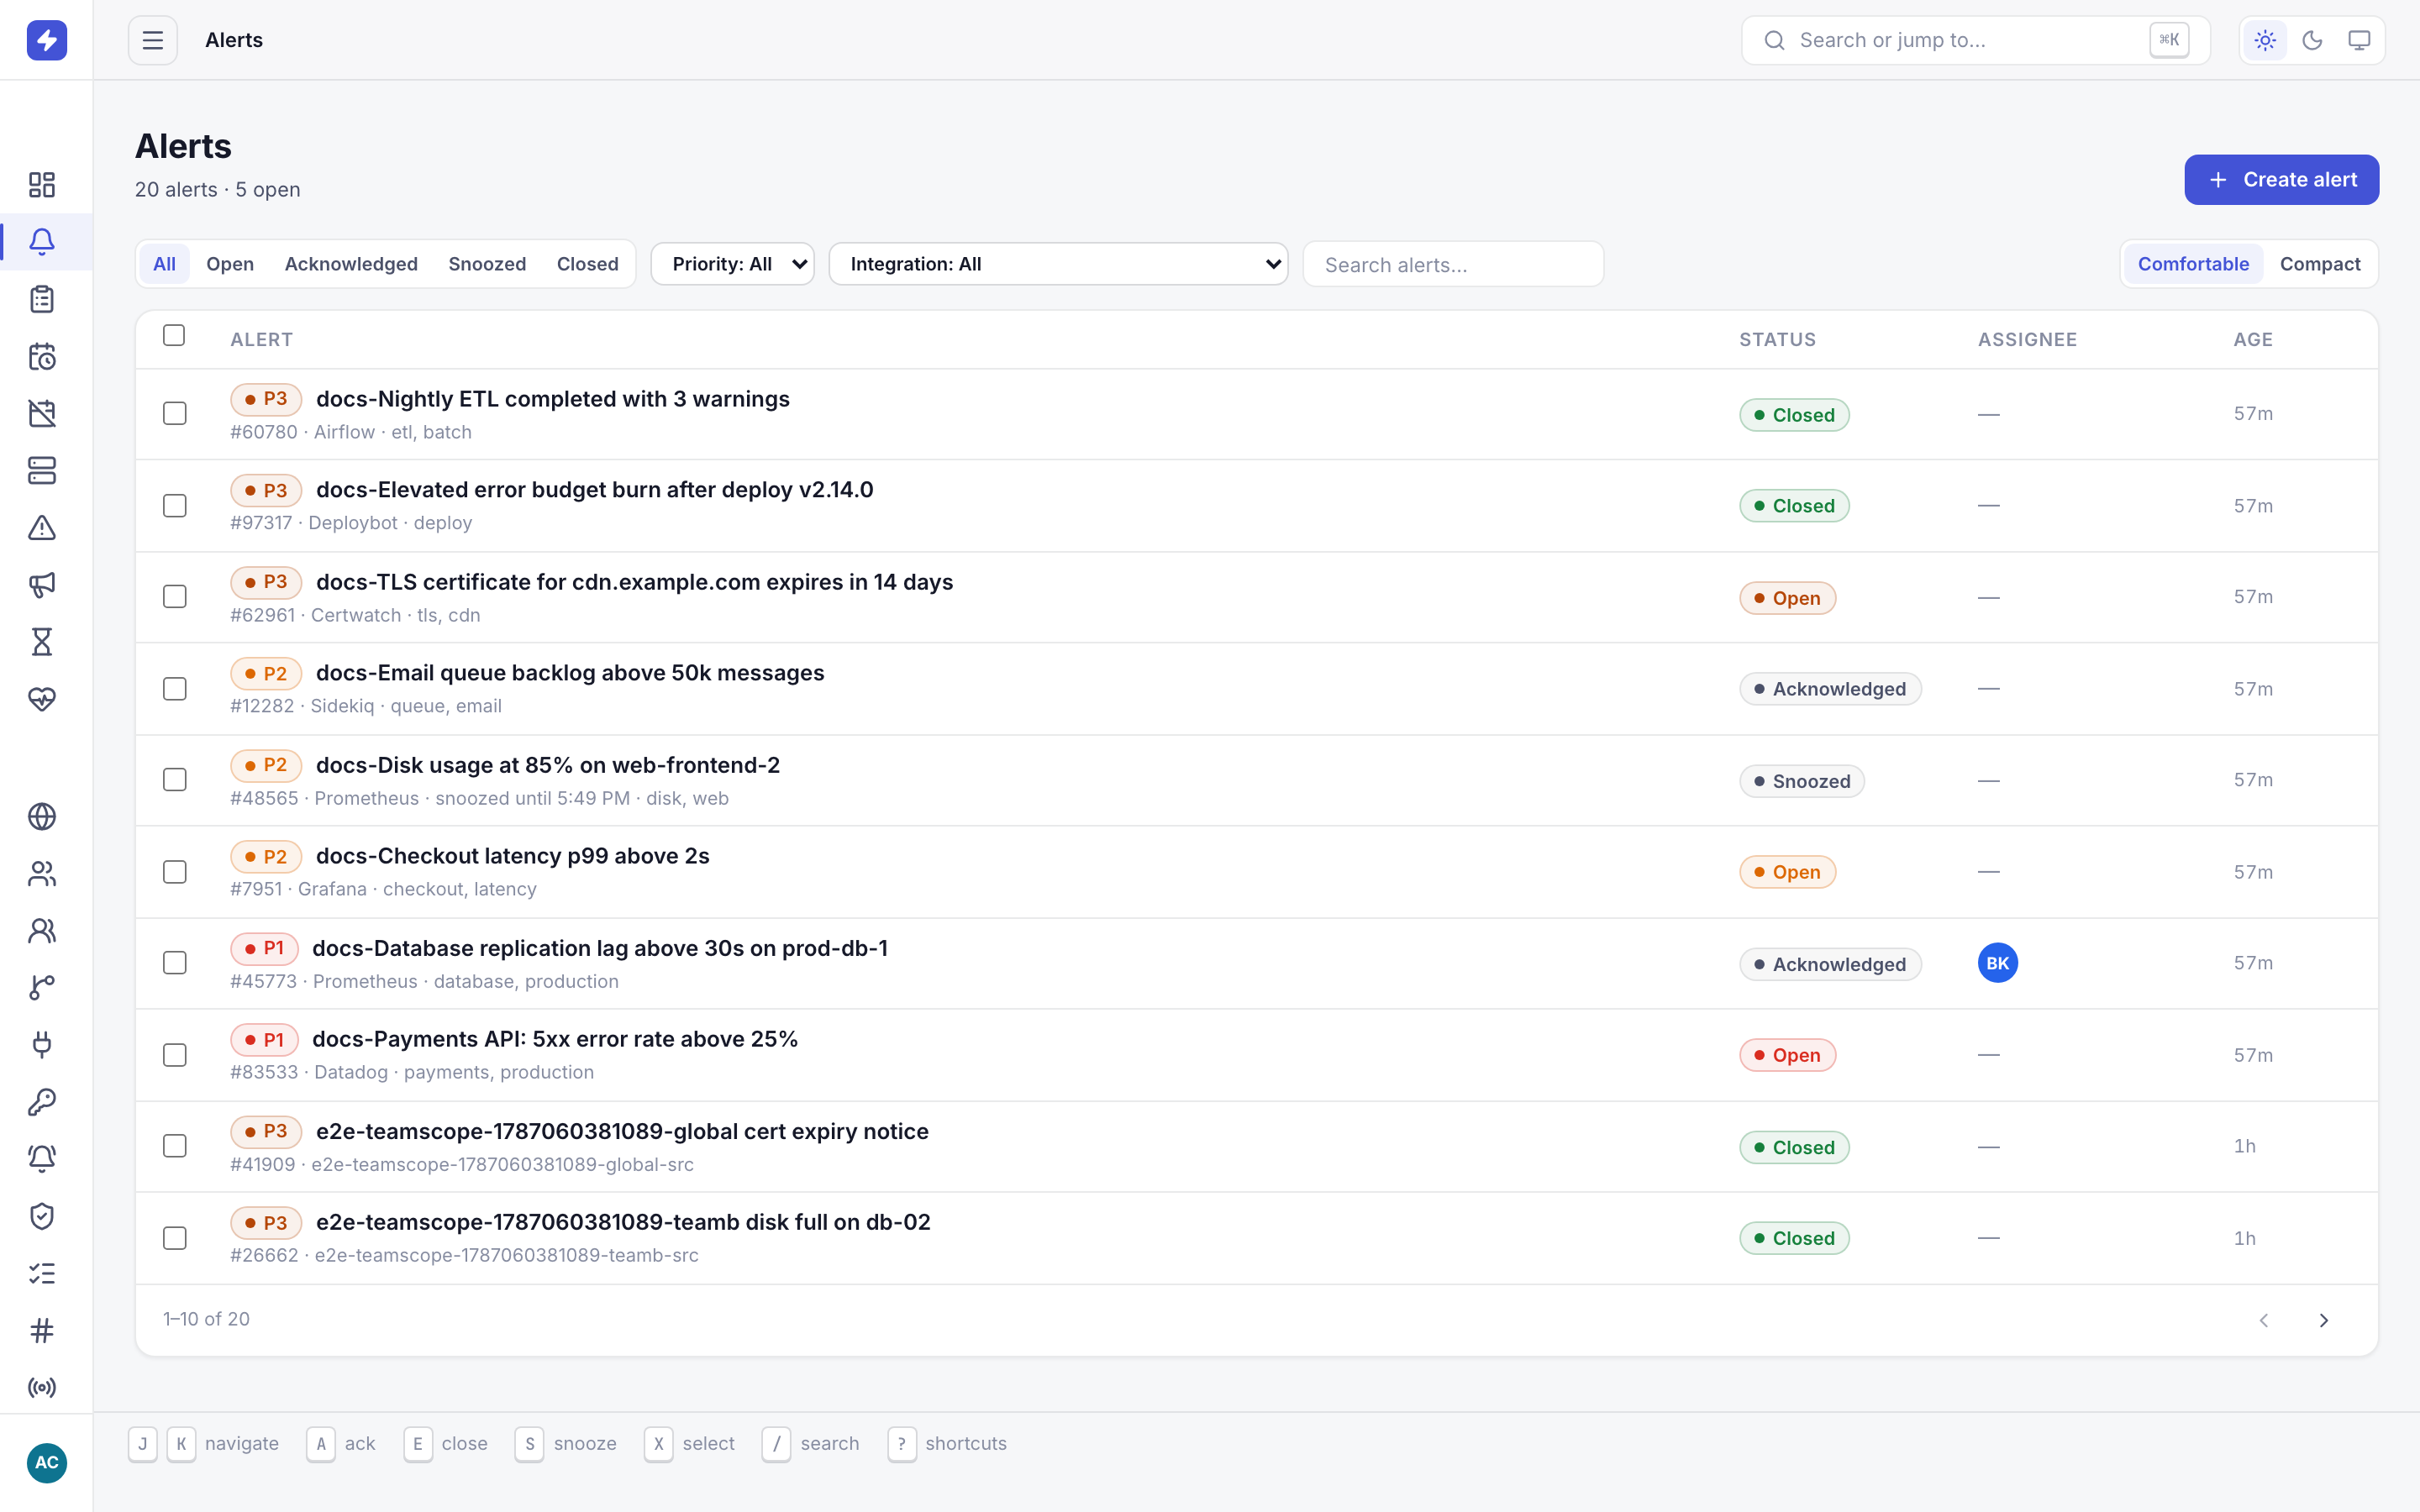
The alerts list with the status filter set to All. Use the chips to filter by Open / Acknowledged / Closed, and the search box for full-text filtering. You're live. Point your real monitoring tool at the same endpoint and the next alert that fires will page whoever is on call.