Incidents & Services
Alerts are symptoms. Services tell you which system is hurting, and incidents are how the team coordinates the fix. This guide covers the layer above the alert queue: the service catalog, incident response, cron monitoring, and planned maintenance.
- Alerts flowing in, per Getting started.
- Admin access for creating services and maintenance windows; anyone can declare an incident from an alert.
-
Model your systems in the services catalog
Services are the things you actually run — APIs, frontends, databases. Each service has a health state (OK, degraded, or down) that rolls up from its alerts, and the page header summarizes the whole fleet at a glance. Create a service per system you page for, and tag incoming alerts with the service they belong to so health stays honest.
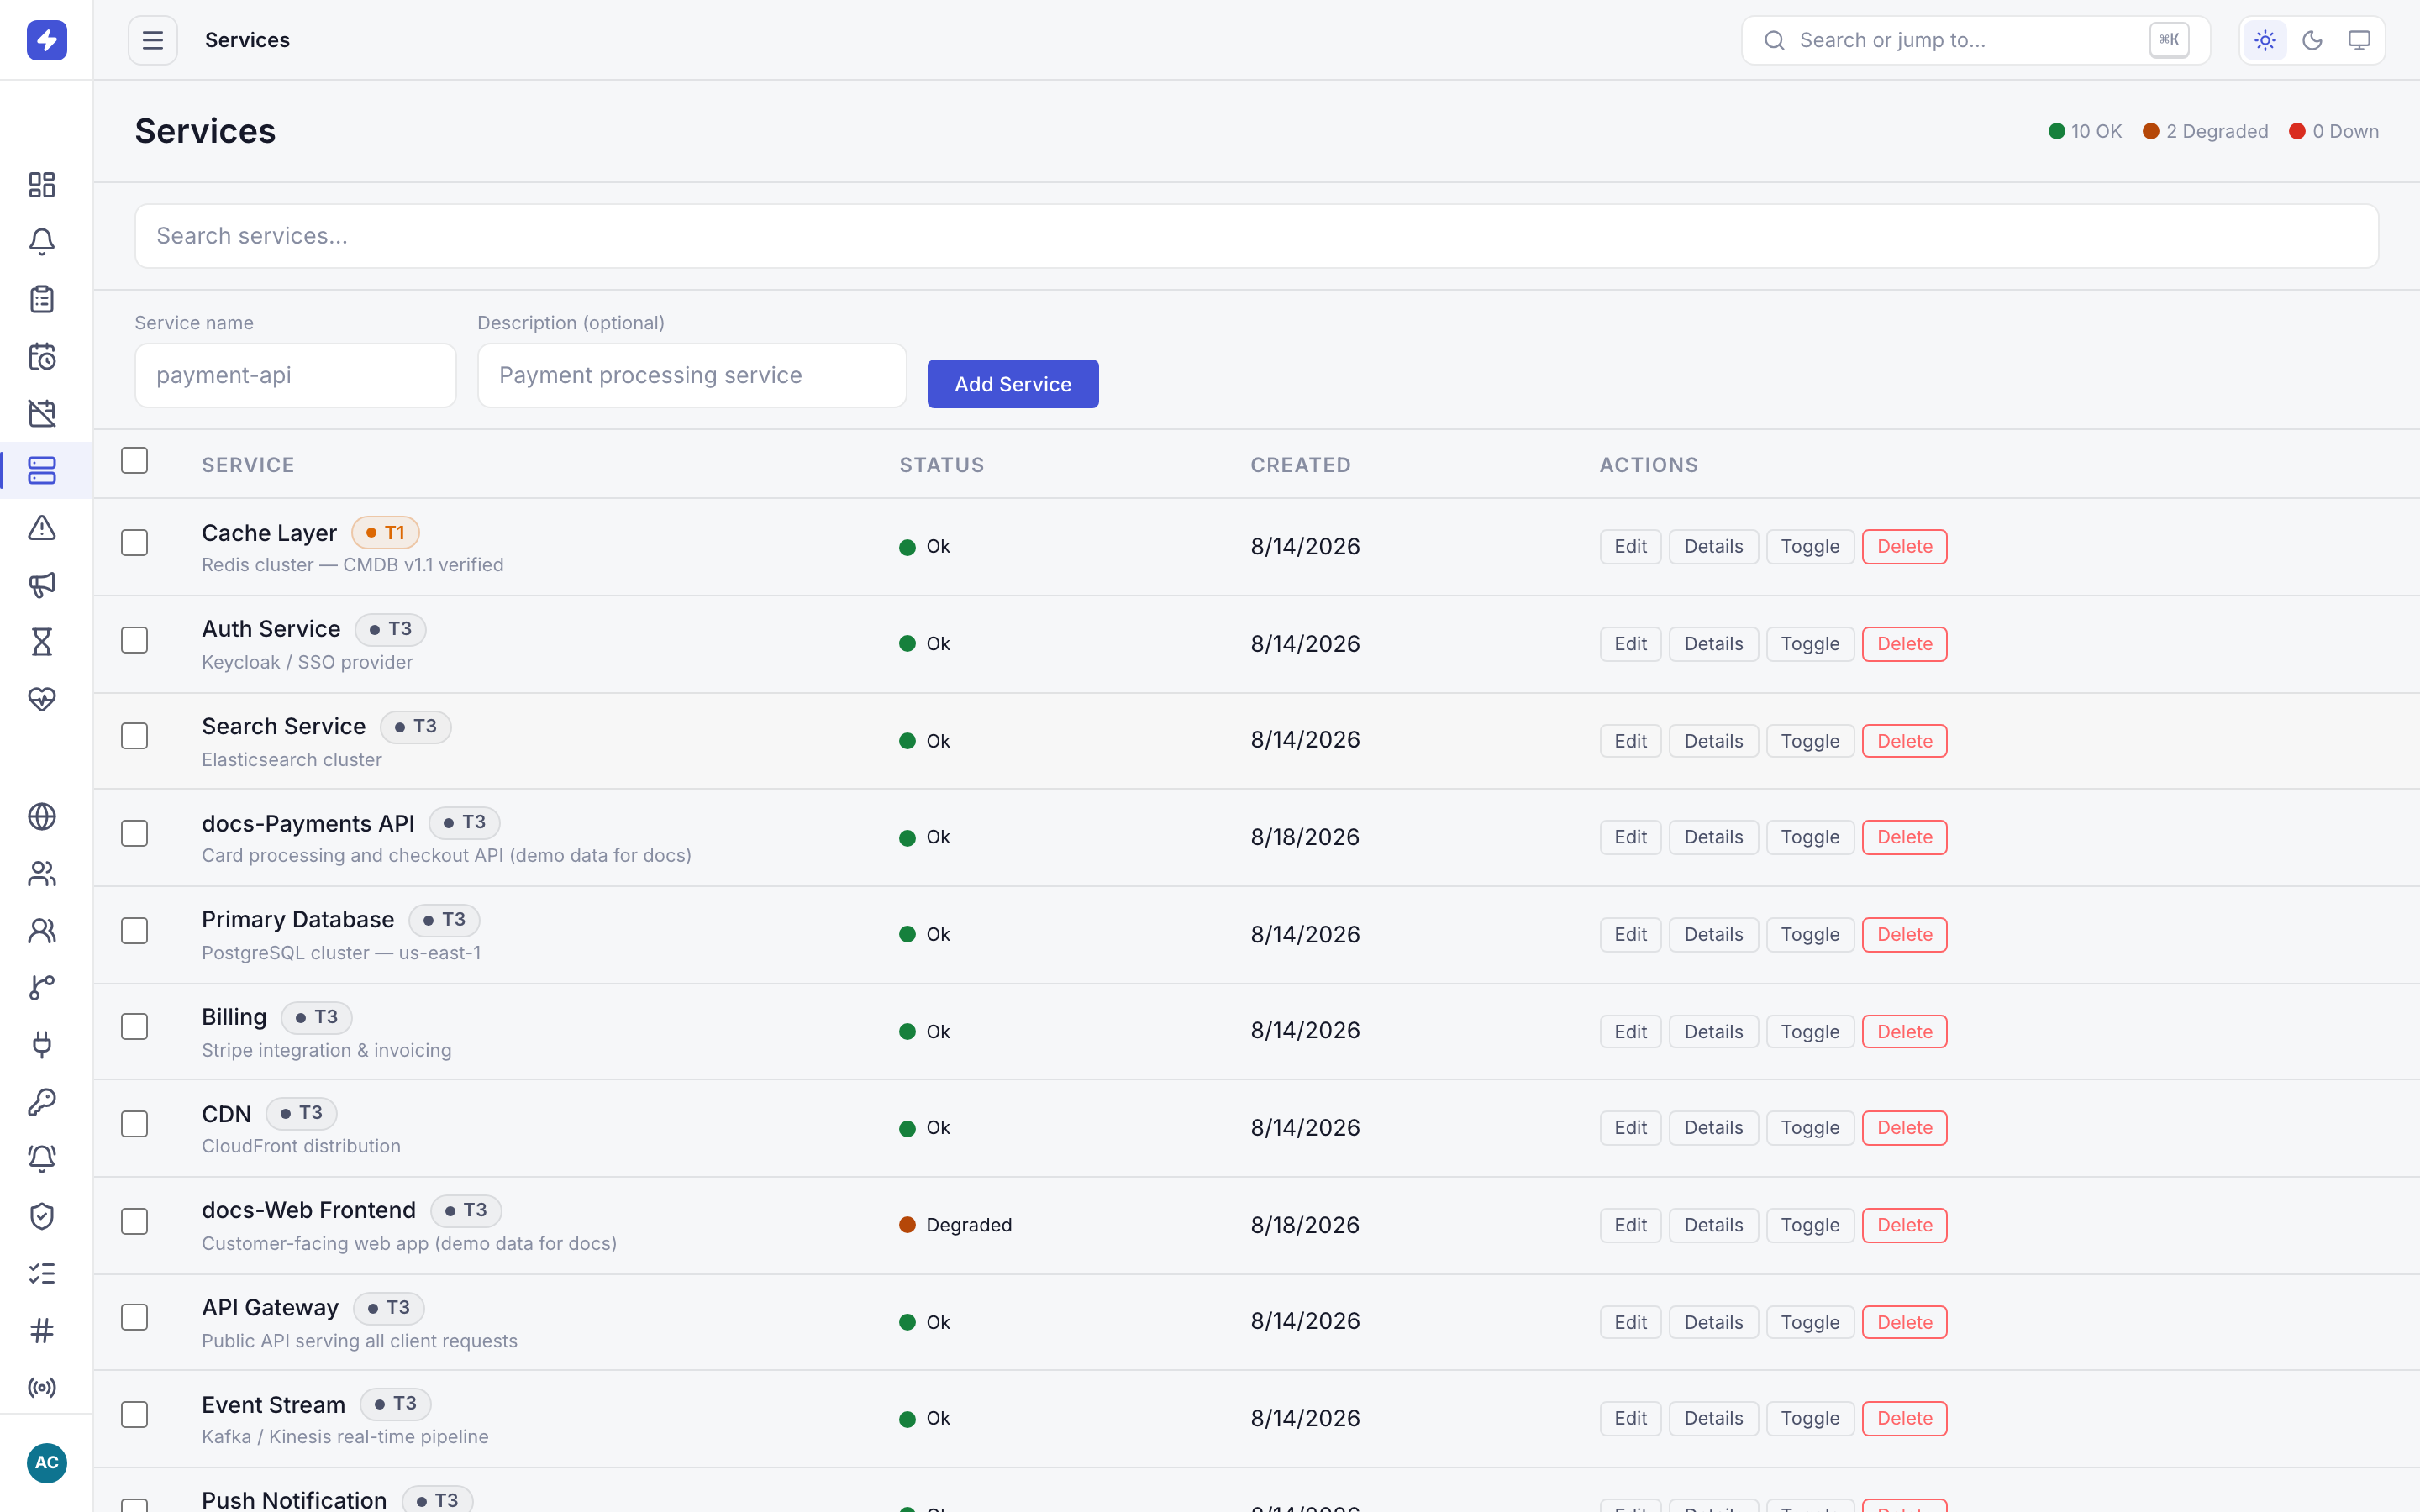
Services track the health of your systems. The header summarizes how many services are OK, degraded, or down. -
Declare an incident from an alert
When an alert is bigger than one person — customer-facing, multi-system, or just unclear — promote it. The Declare incident action on the alert detail page creates an incident with the alert already linked. You can also create incidents inline from the Incidents page, which lists open and resolved incidents with priority and status.
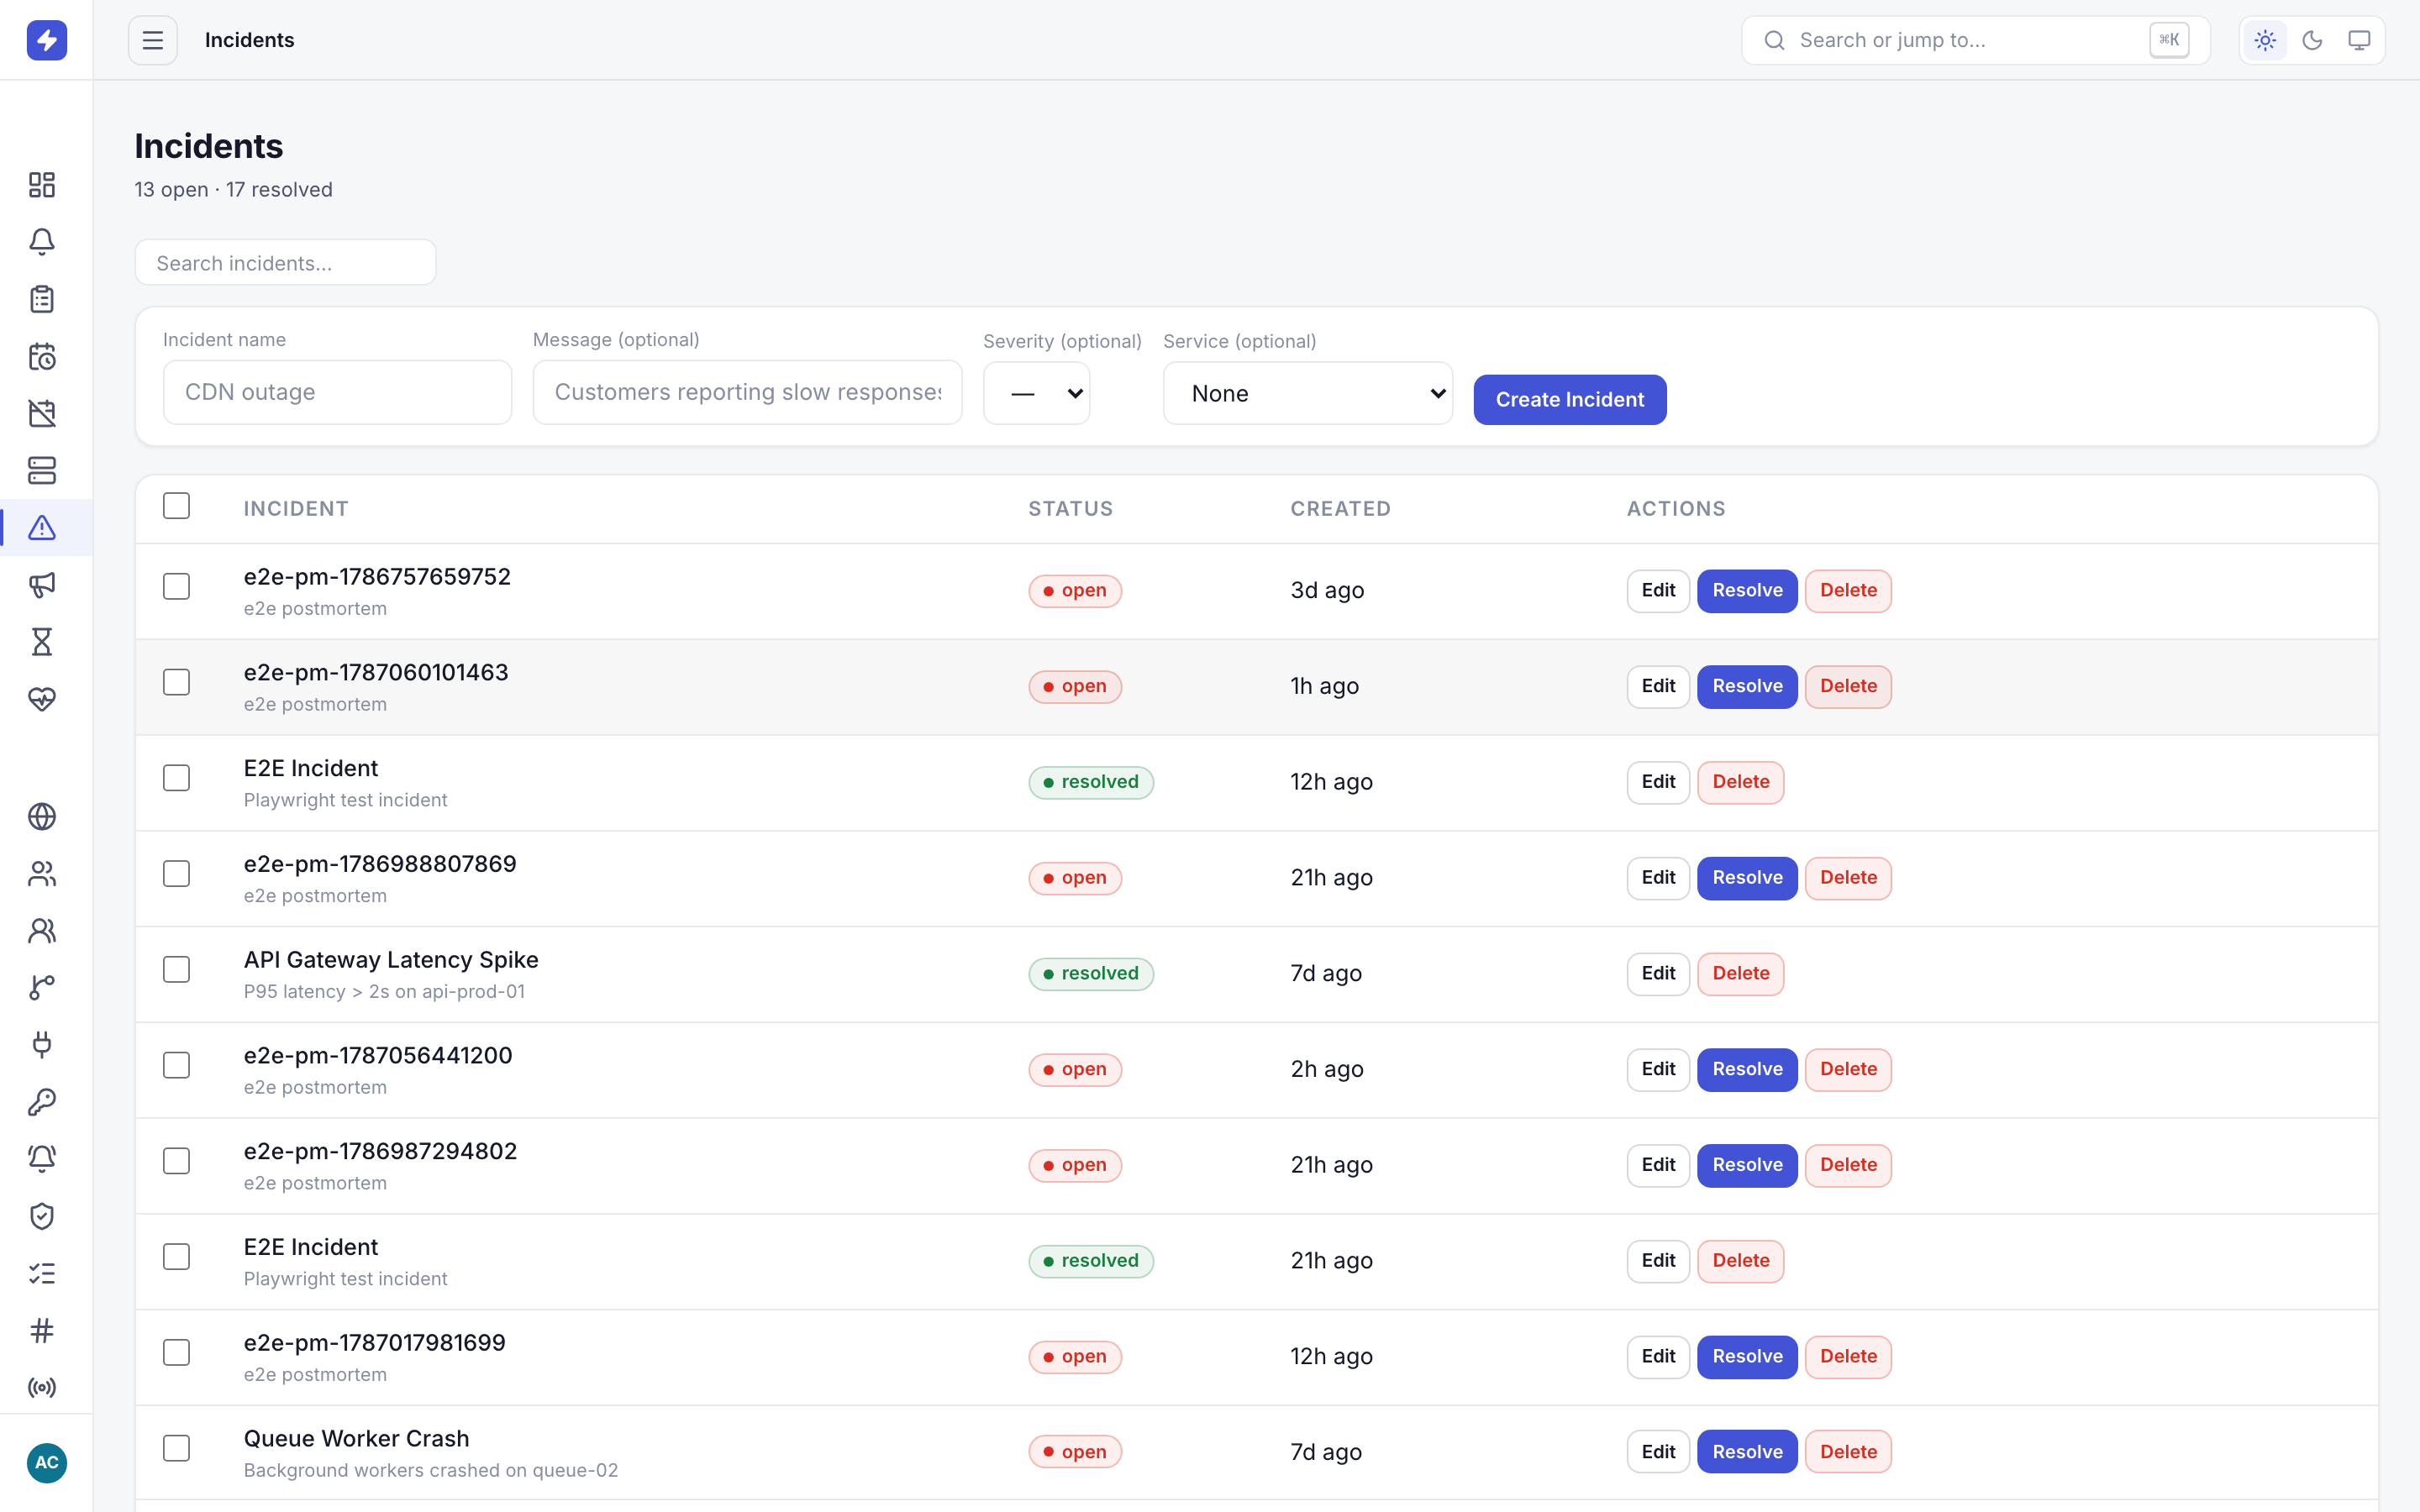
The incidents list shows open and resolved incidents with priority and status. Create an incident inline or declare one from an alert. TipDeclare early. An incident costs nothing but a name; an hour of three people independently investigating the same P1 costs real sleep. The rule of thumb: if you're about to message a second person about an alert, it's an incident.
-
Run the incident with status updates
The incident detail page is the shared picture: overview, tags, responders, impacted services, linked alerts, and the status timeline. Move the incident through its states — investigating, identified, monitoring, resolved — and post status updates as you go. Every update lands in the incident's Status updates section with a timestamp and an author, which becomes the post-incident record; the Status Timeline tracks the lifecycle markers (created, resolved) rather than the updates themselves.
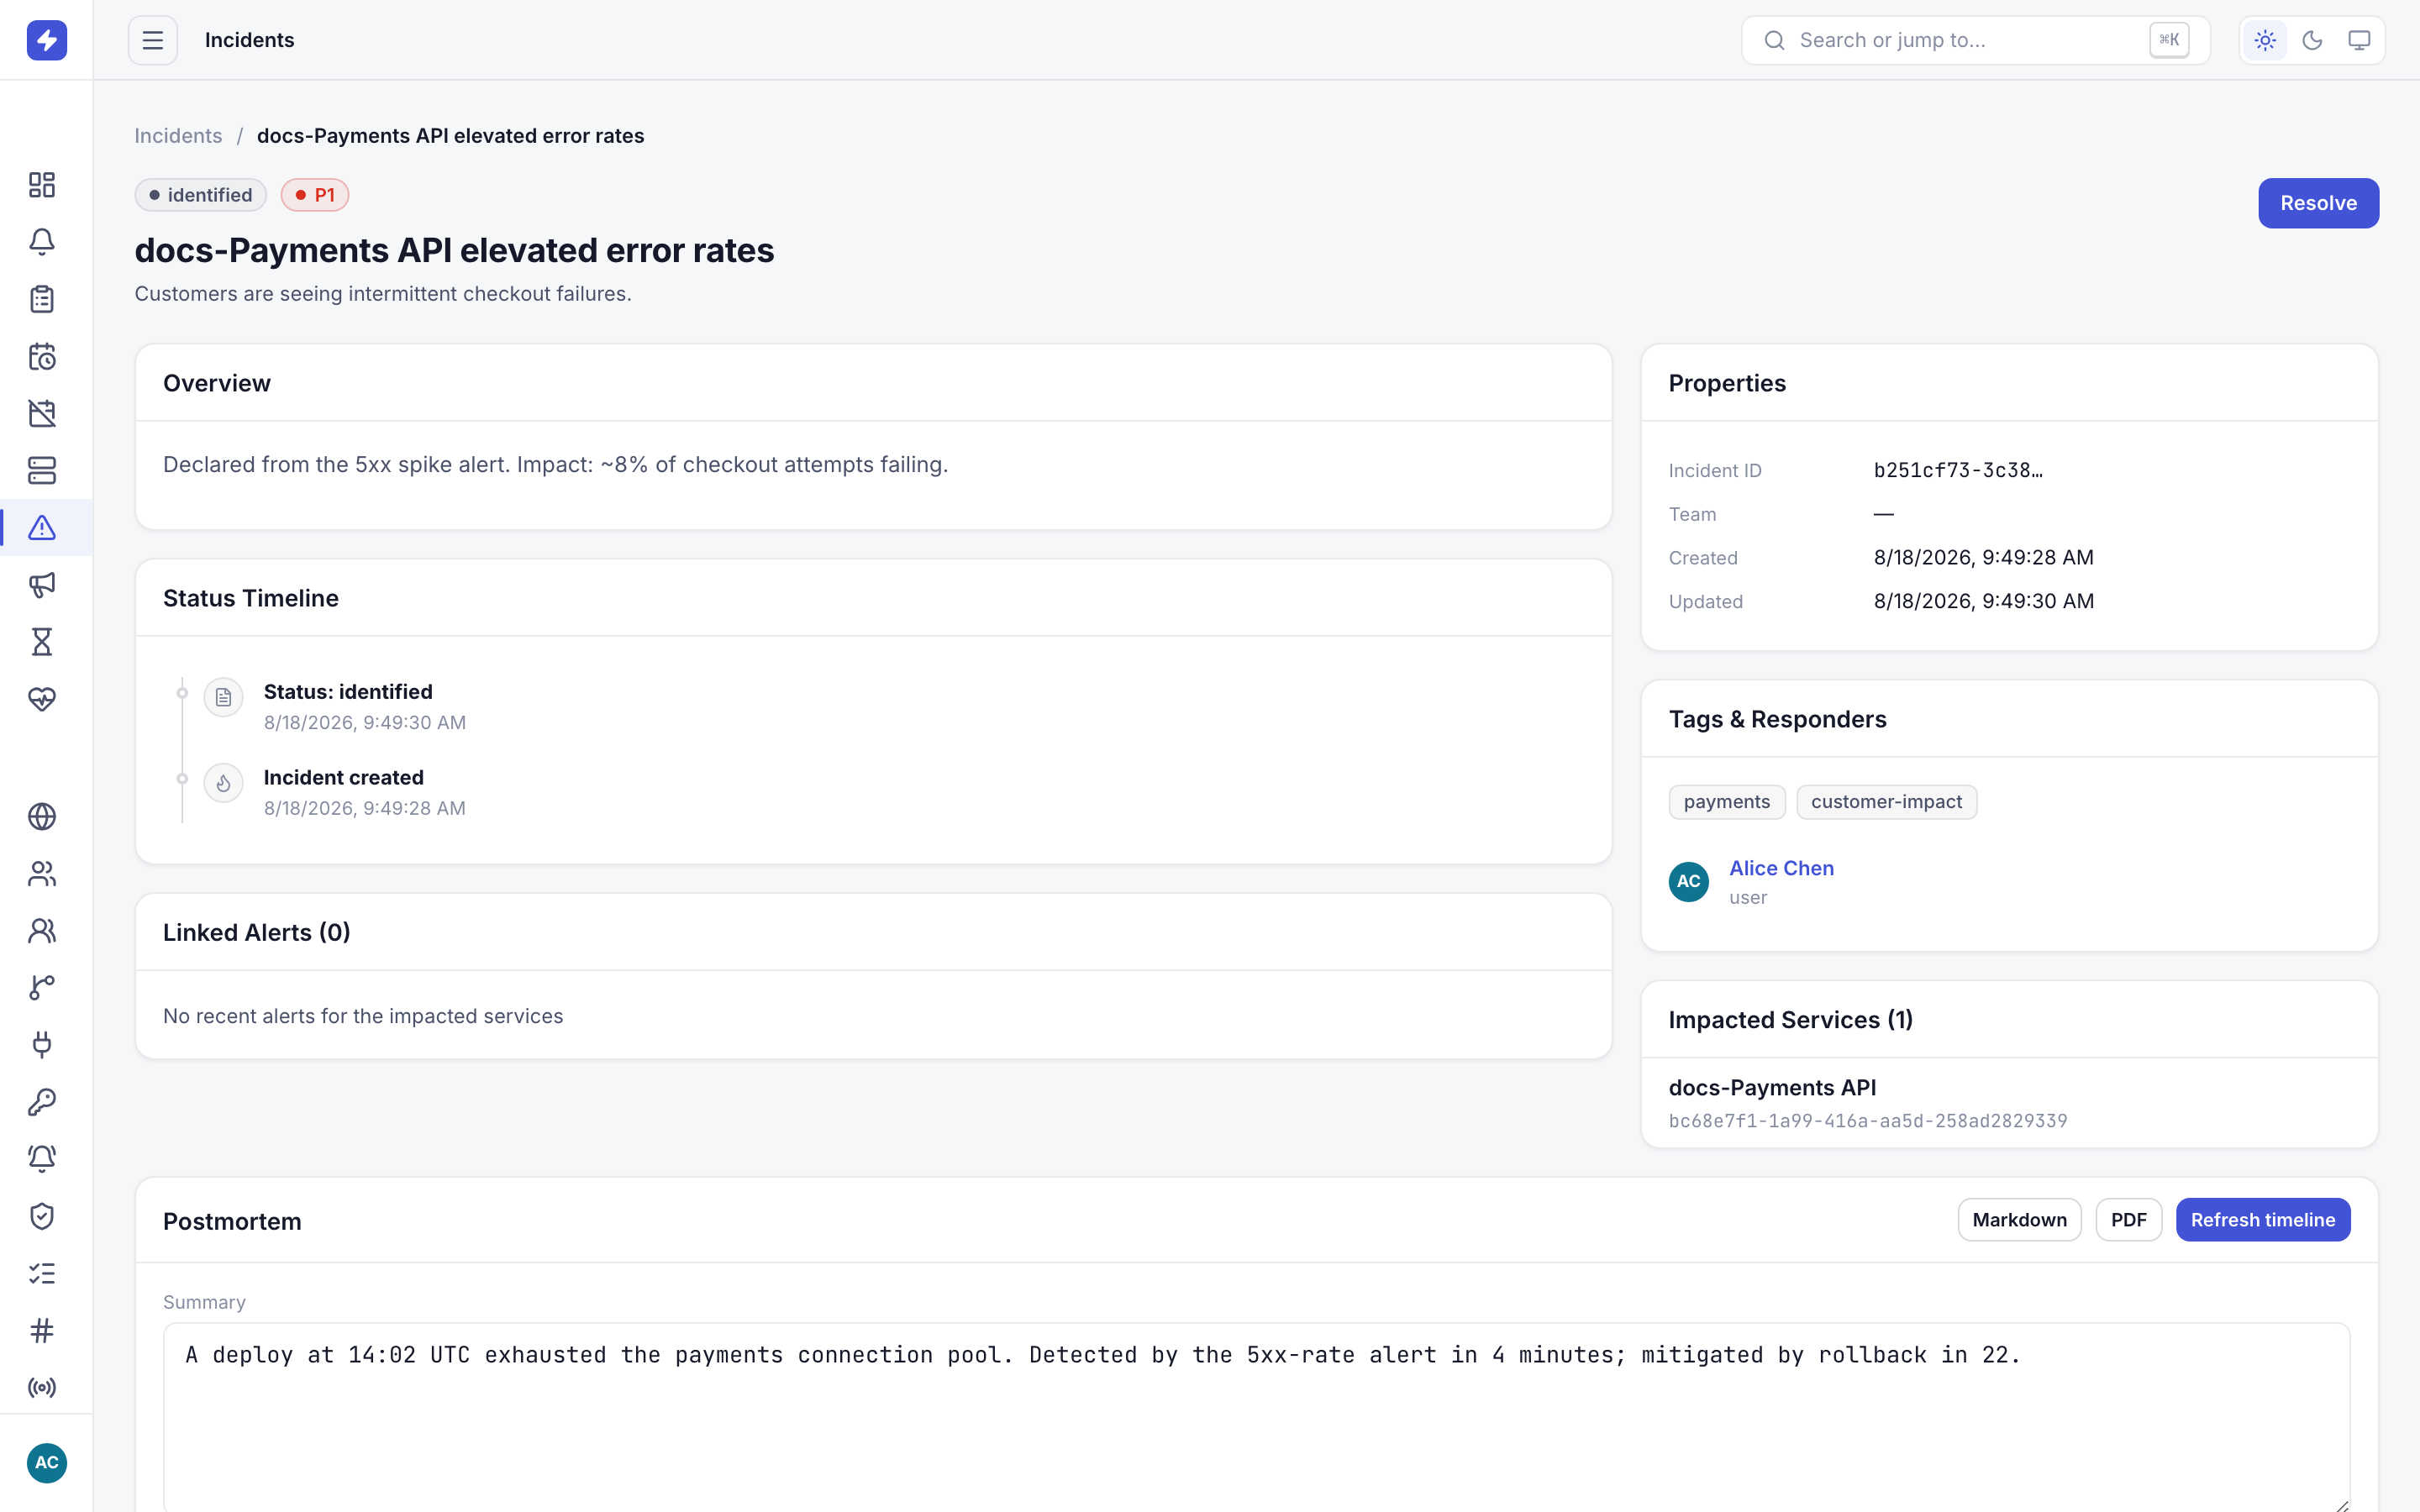
Incident detail: overview, tags and responders, impacted services, linked alerts, and the status timeline. NoteStatus updates are for the team, not just the log. When someone joins an incident cold at 4 a.m., the timeline is the briefing — write the update you'd want to read.
-
Monitor cron jobs with heartbeats
Some failures are silent: the nightly ETL that simply doesn't run raises no alert. Heartbeats invert the model — your job pings OpsPing when it finishes, and if no ping arrives within the expected interval, OpsPing raises an alert for you. Create a heartbeat per scheduled job, then have the job hit the heartbeat URL on success.
curl -X POST https://api.ops-ping.com/v2/heartbeats/nightly-etl/ping \
  -H "Authorization: OpsPingKey YOUR_API_KEY"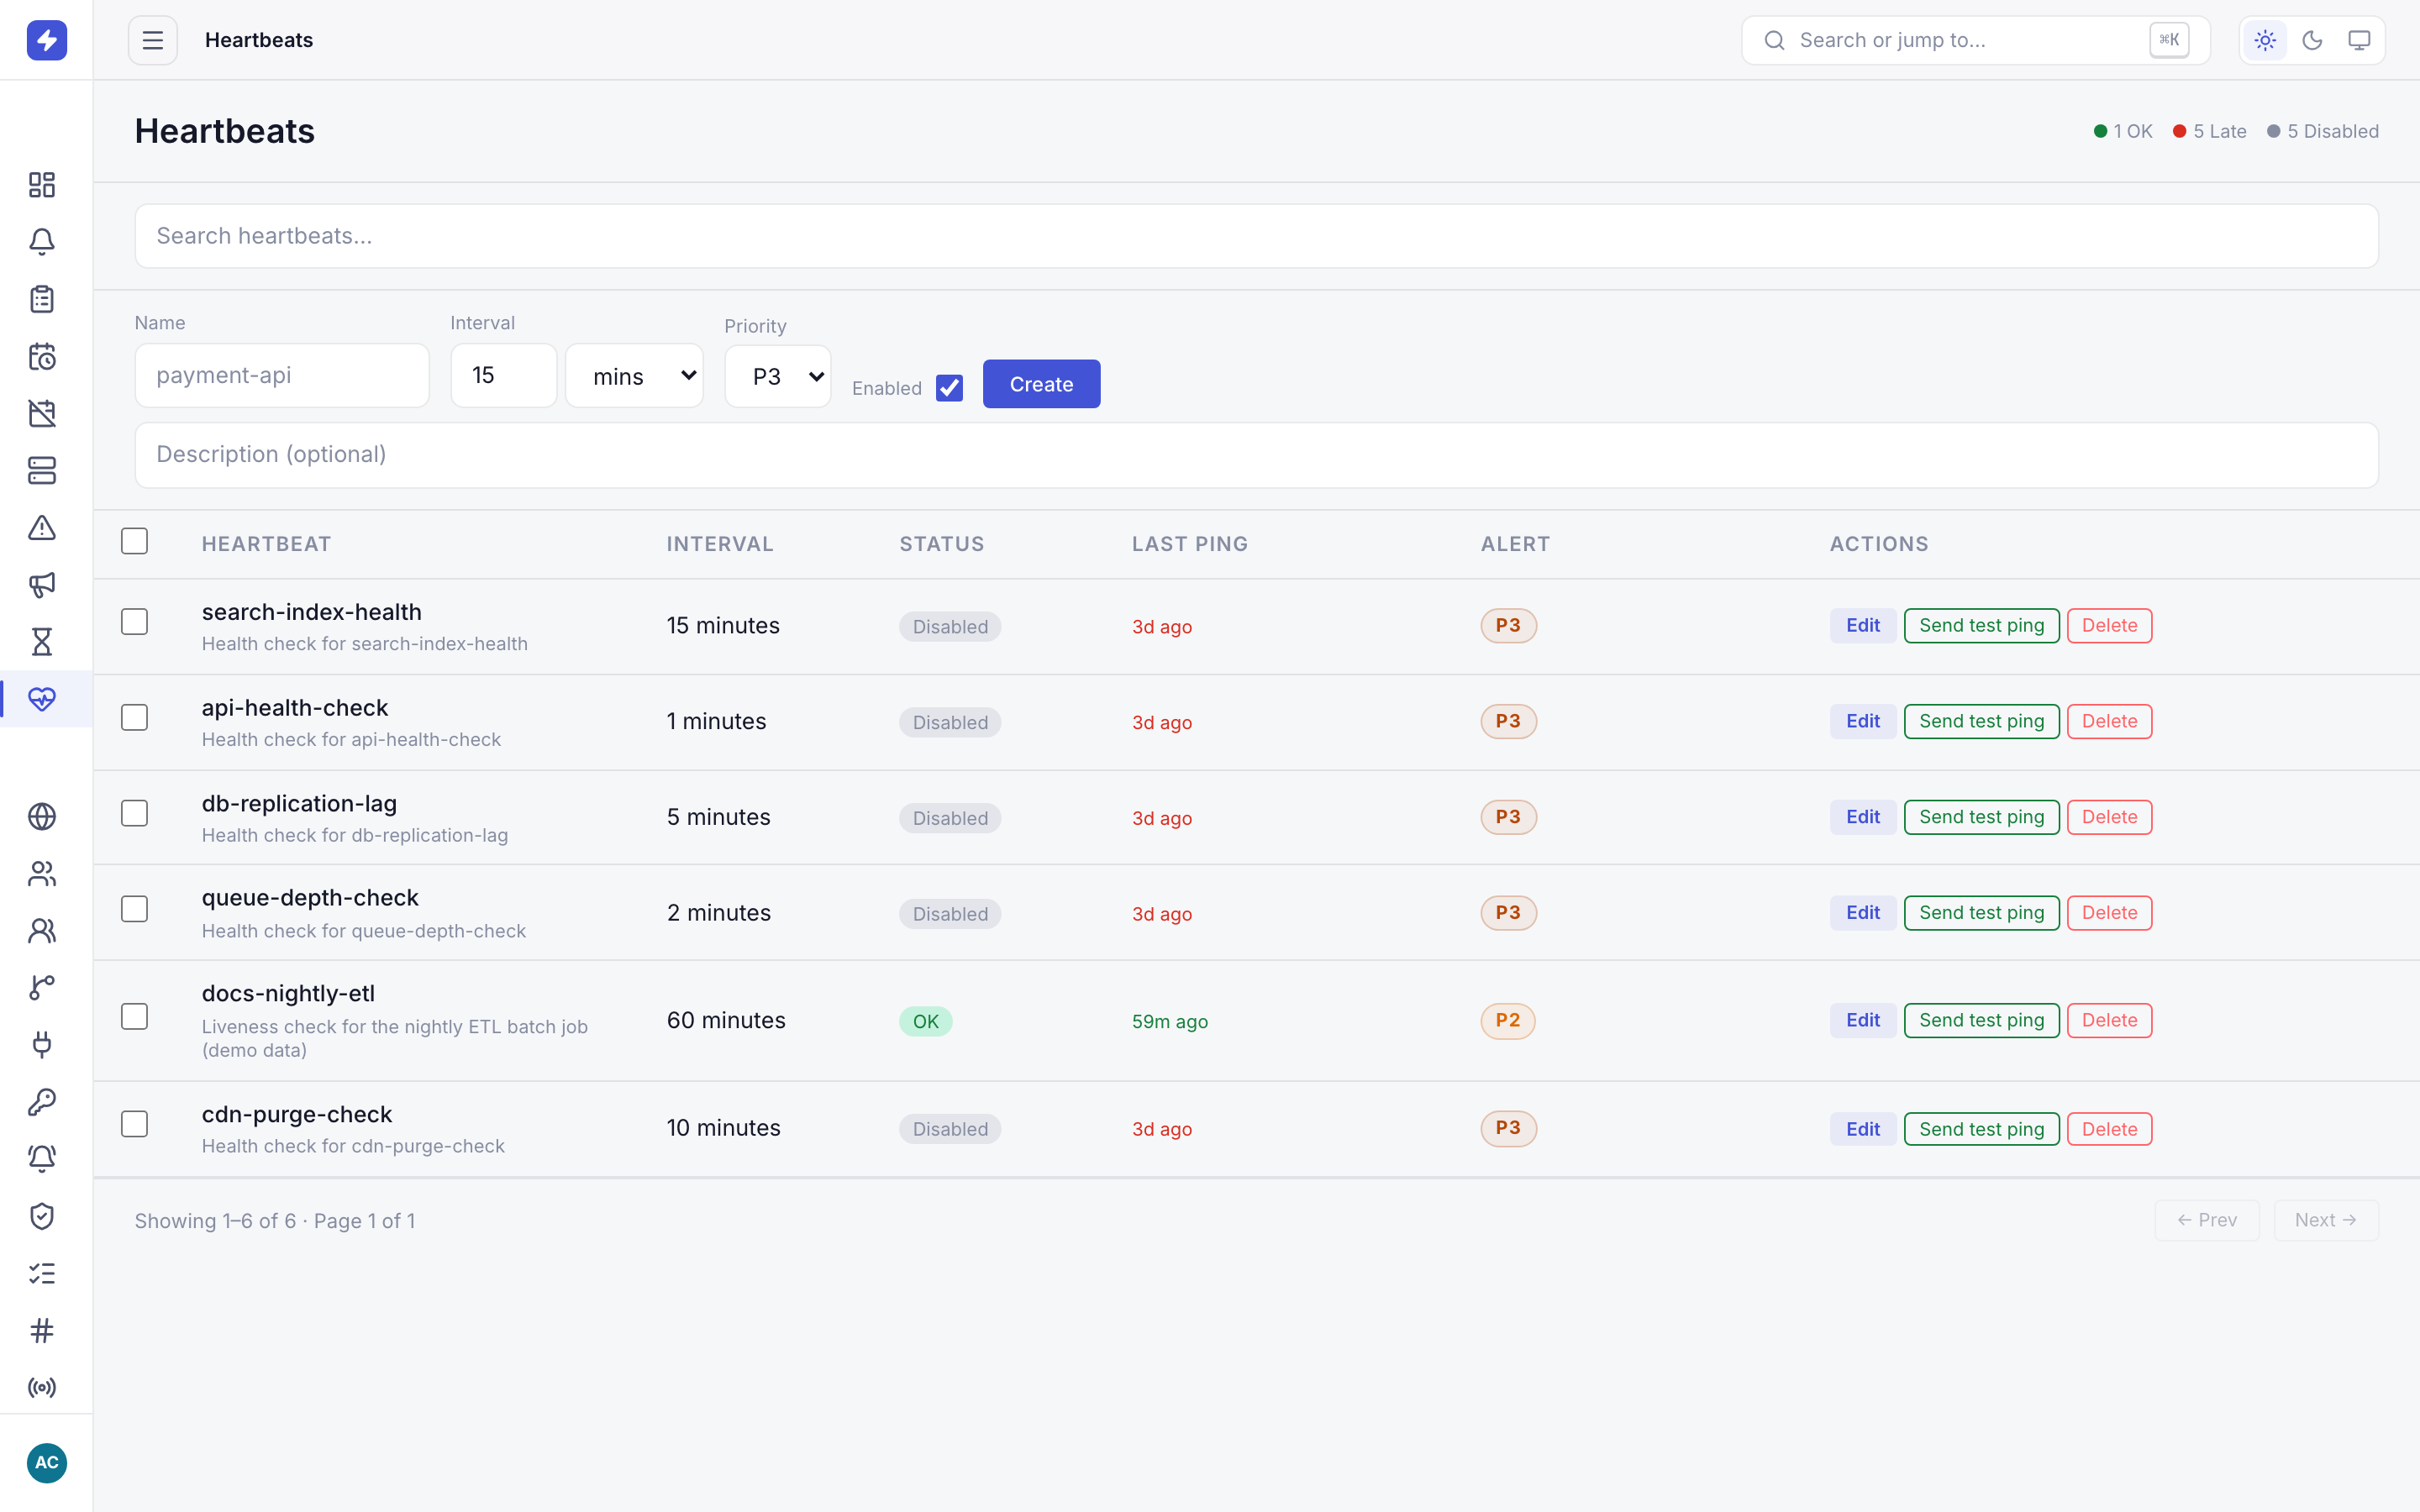
Heartbeats monitor cron jobs and batch processes: if a ping does not arrive within the interval, OpsPing raises an alert. TipPut the ping at the end of the job, after the work succeeded — not in a wrapper that fires when the script starts. A heartbeat that pings on launch tells you the job started, not that it finished.
-
Silence planned work with maintenance windows
Deploys and migrations produce alerts you already expect. A maintenance window suppresses alerting for a service or team during planned work, so the migration's noise doesn't page anyone or pollute your MTTA stats. The page groups windows into upcoming, active, and expired.
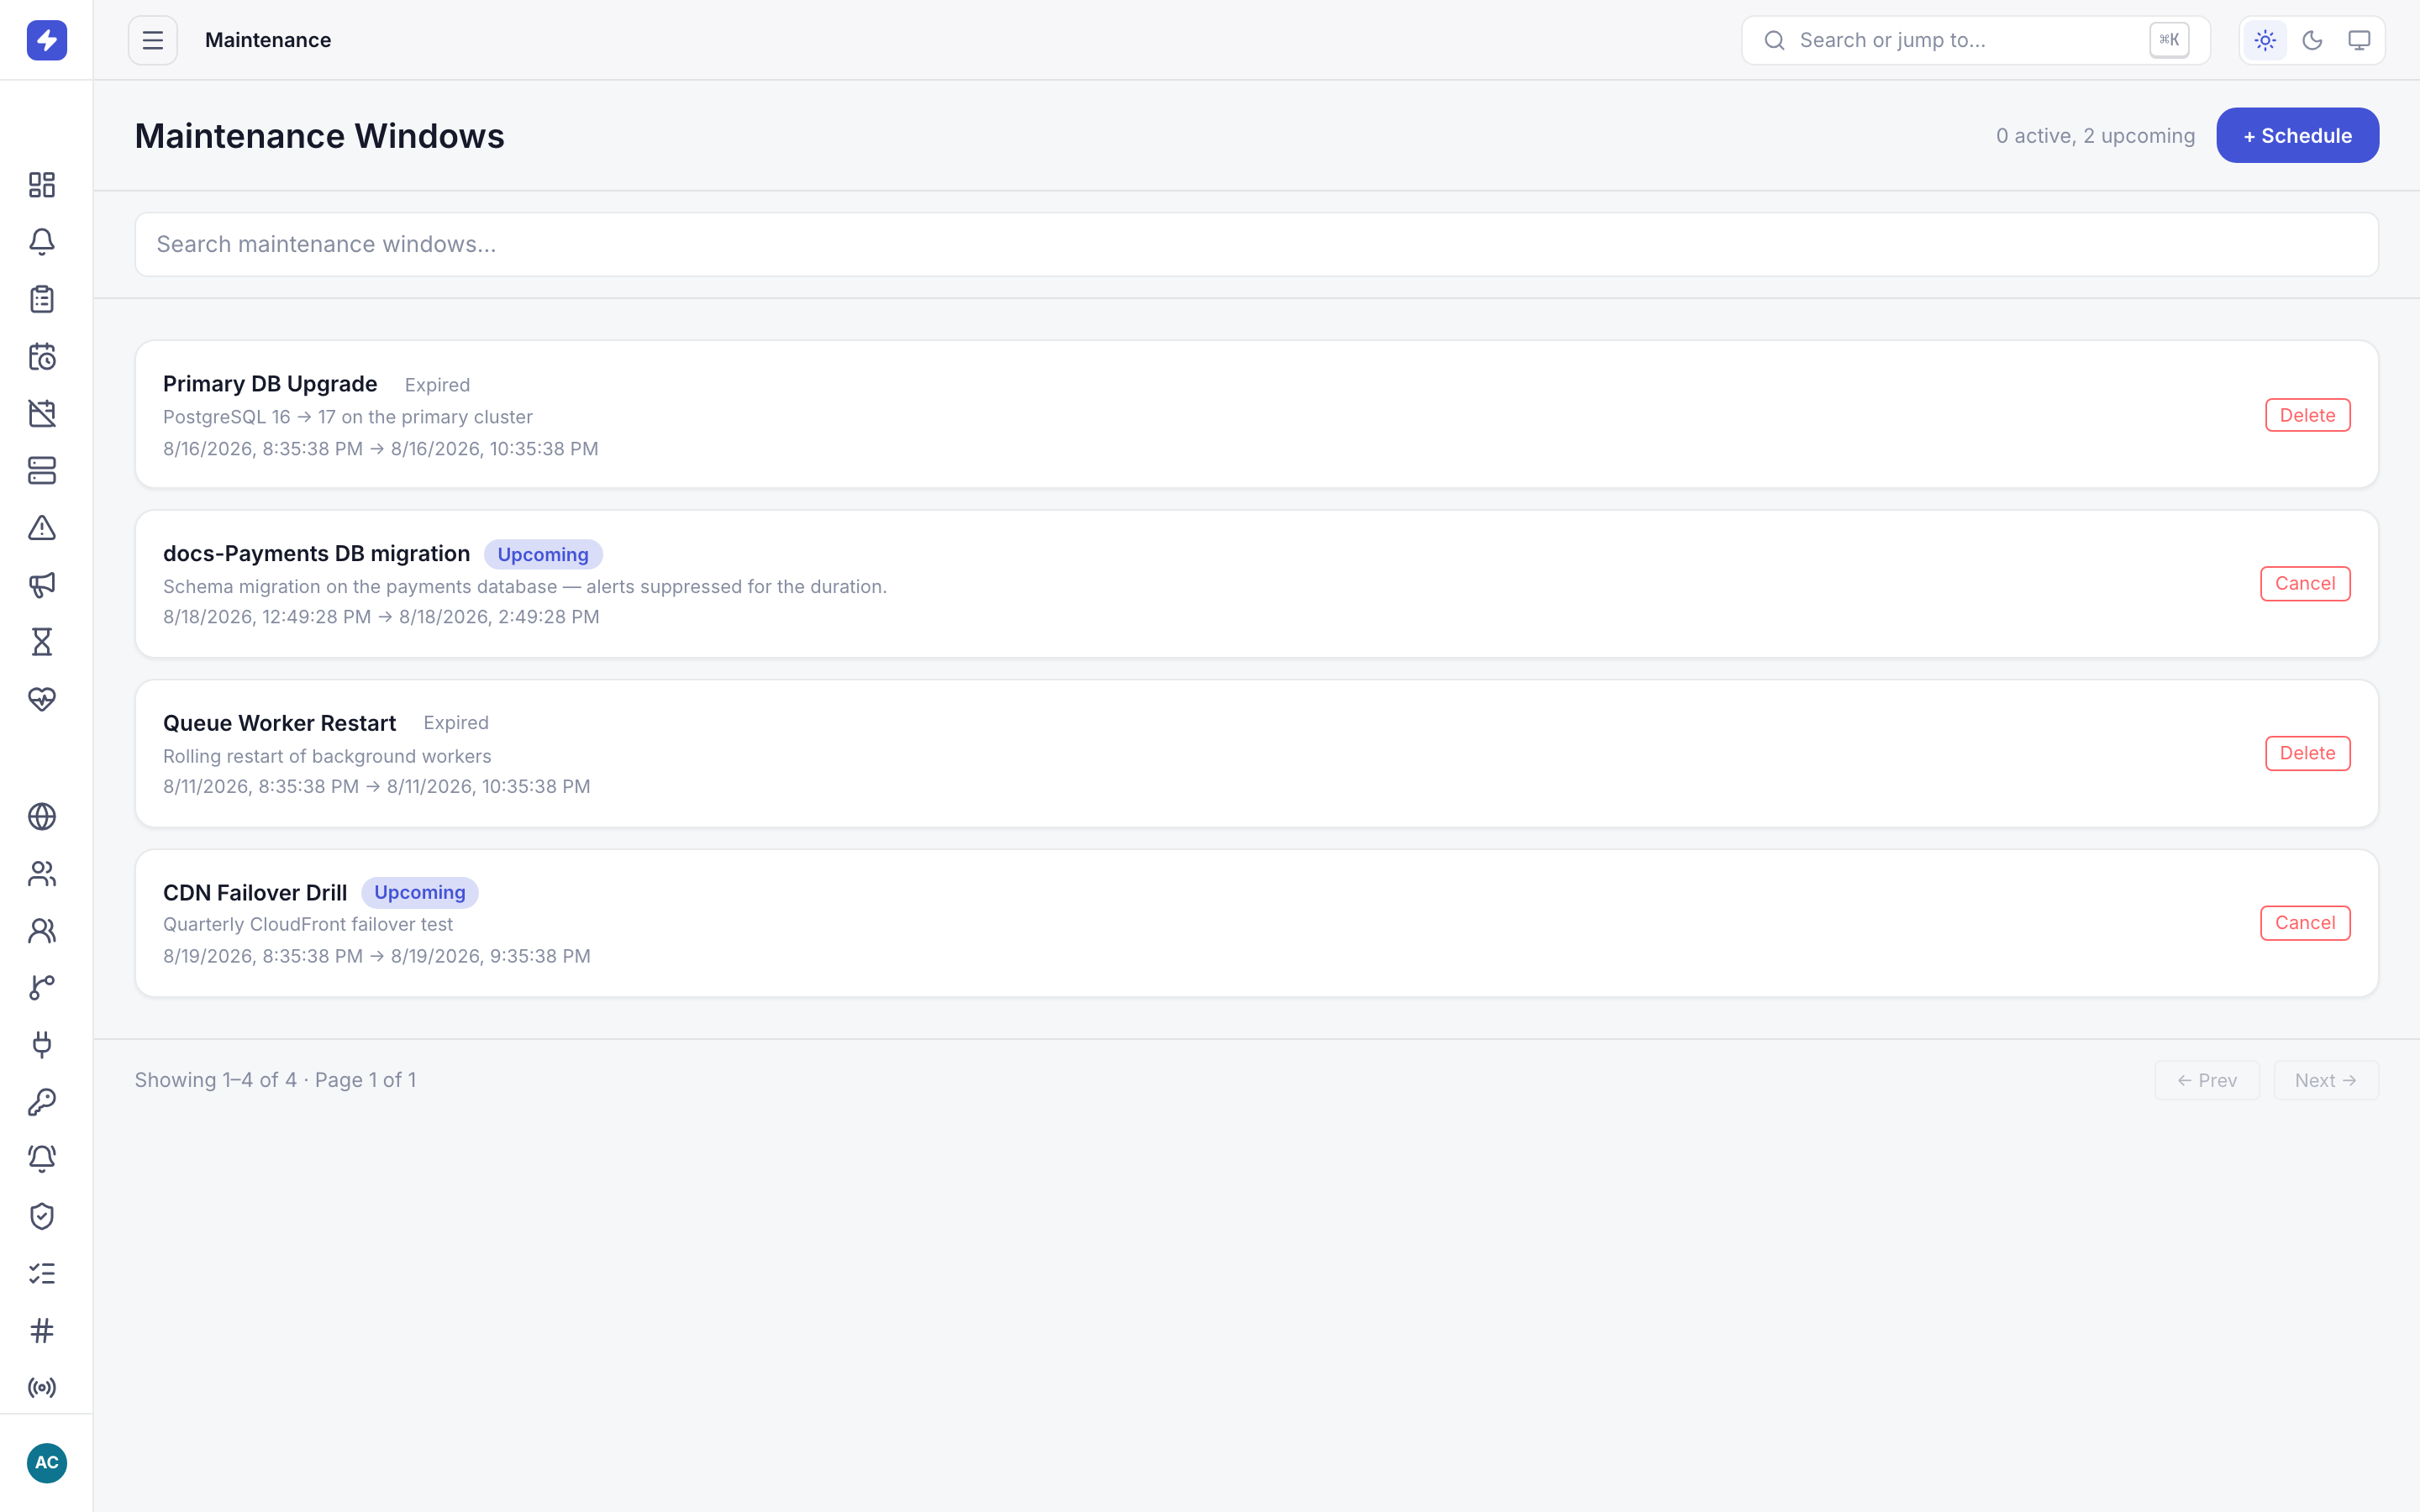
Maintenance windows suppress alerts for a service or team during planned work. Upcoming, active, and expired windows are grouped on the page. WarningMaintenance windows suppress real problems too. Scope them tightly — one service, the actual deploy window — rather than a whole team for a whole evening. "We were in maintenance" is not a good answer to "why did nobody see the outage."
-
Watch it all from the mobile health tab
The mobile Health tab rolls incidents and services into one view: active incidents, service status cards, and shortcuts to resolve an incident or declare a new one. It's the pocket answer to "is anything on fire right now?"
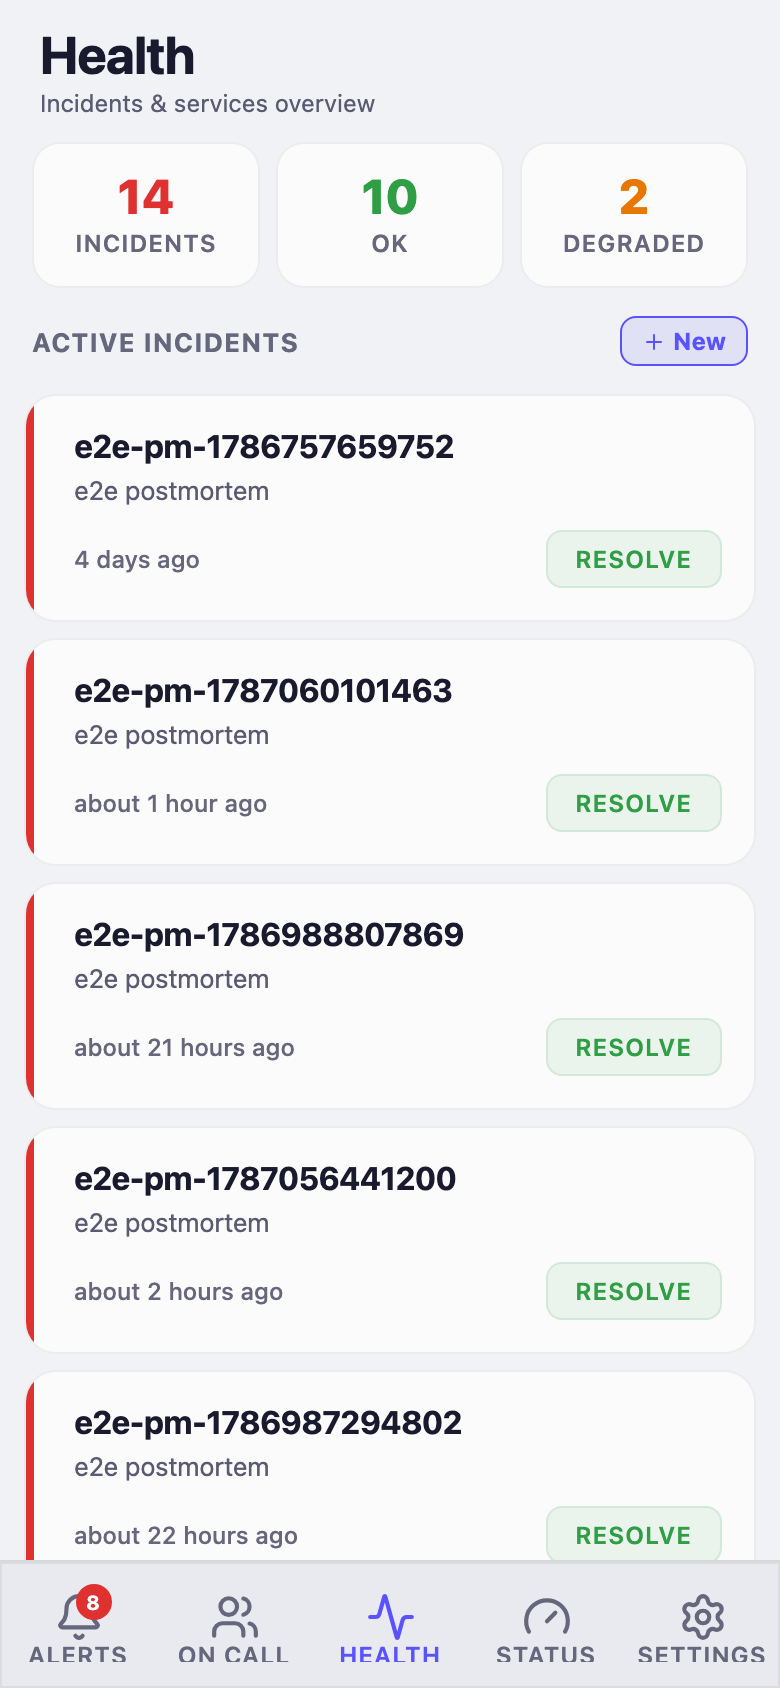
The health tab summarizes active incidents and service status, with shortcuts to resolve incidents or declare a new one. -
Attach runbook context with service fields
A service is more than a name and a health state. Give it a tier, link its on-call schedule, name its owners, and fill in the runbook URL and Slack channel. Alerts tagged with the service carry that context with them: the alert detail shows a service card with the tier badge, who's currently on call, and a link straight to the runbook — no hunting for the wiki page at 3 a.m. When you create an alert, OpsPing also suggests the service's owners as responders.
TipThe fields pay off where the alert lands, not just in the catalog. With the Slack integration installed, pasting an alert link into a channel unfurls with the service context attached — see Slack ChatOps.
-
Generate a postmortem when it's resolved
When the incident is resolved, the record shouldn't evaporate. OpsPing generates a postmortem from the incident's audit trail — timeline, status updates, responders, linked alerts — and regenerating never clobbers your edits. Export to Markdown or PDF for the review meeting. The full walkthrough lives in Postmortems.